The San Jose Sharks have a made a reputation of being a very up-and-down team so far this year. After a terrible off-season, the club seems to have lost their identity and have become very unpredictable. In their most recent homestand, the Sharks downed the Anaheim Ducks, Los Angeles Kings, and Chicago Blackhawks all in a row before losing to the Edmonton Oilers in a shootout. This team just doesn’t make sense. San Jose’s highs and lows have made for a very interesting season with some very interesting statistics.
Melker Karlsson’s Shooting Percentage
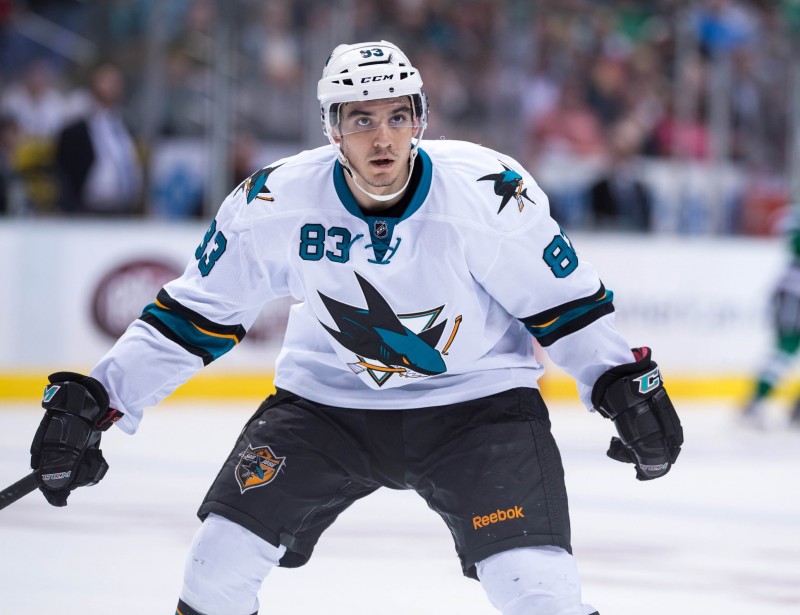
No surprise has been more pleasant to San Jose Sharks fans than the success of Swedish forward, Melker Karlsson. In just 22 games, the rookie has posted eight goals and five assists, tying him for 12th on the team in points. His stellar play is a large reason why the Sharks are sitting in second place in their division. While his point totals are impressive, his shooting percentage is mind-boggling.
After taking 37 shots in teal, Karlsson has recorded an insane shooting percentage of 21.6%. It may be a reasonably small sample size, but one would think that it is large enough to have his number be closer to the league average 9.05%. This is not the case. Instead, he has become a scoring machine and even went on a five game goal streak earlier in the year. His percentage will likely regress closer to the league average as the season progresses, but until then Karlsson will be considered one of the deadliest Sharks in the lineup.
Matt Nieto’s Corsi
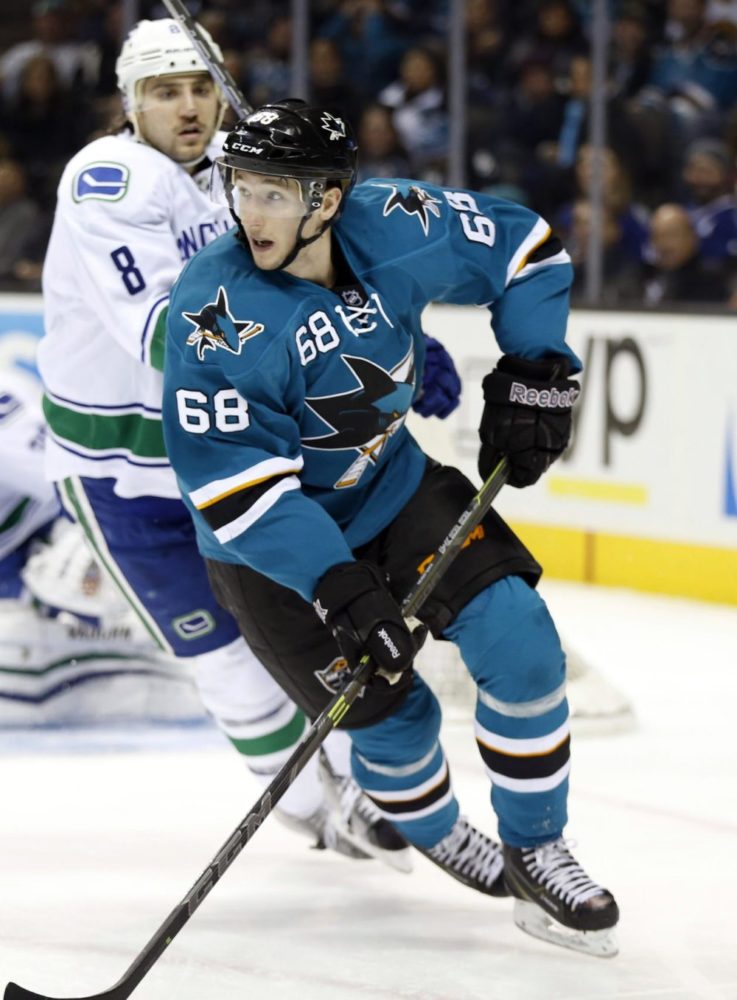
Long Beach native, Matt Nieto, has been one of the most snakebitten skaters in teal, along with his linemate, Patrick Marleau. Despite being in prime scoring areas and generating a number of quality chances, he has just 13 points in 41 games. As a result, he has an incredibly unlucky PDO of 96.6%. Nieto’s luck will hopefully improve by the start of the postseason, but even though he is struggling in points, he is a possession beast.
The speedy winger has established himself as one of the elite possession players in the NHL this season, holding a 57% corsi-for percentage. 57%. That is incredible. To give you an idea of how good that number is, Nieto has similar possession numbers to Anze Kopitar of the Kings. He may not be scoring, but he does an amazing job at pinning teams in their own zone. His speed and puck recovery skills will prove valuable to San Jose down the stretch, whether he puts up points or not.
Antti Niemi’s Point Total
In 38 starts this season, goaltender Antti Niemi has recorded 21 wins, a .913 save percentage, and a 2.55 goals against average. In addition to this, he has also earned two assists. With a whopping two points on the year, Niemi has as many or more points than the following players: Scott Hannan, John Scott, Chris Tierney, Eriah Hayes, Freddie Hamilton, Michael Haley, and Mike Brown. The Finnish netminder has as many points as Hannan, despite playing in one less game and being a goaltender. That’s hilarious.
John Scott’s Penalty Minutes
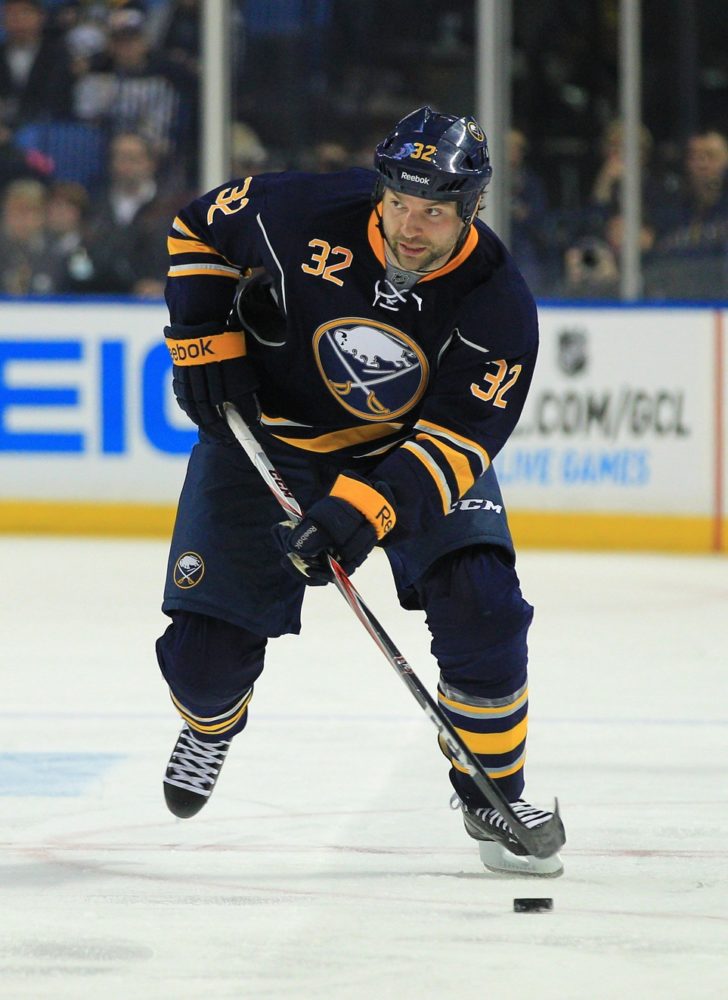
It’s not surprising that professional face puncher, John Scott, has spent quite a bit of time in the sin bin as a Shark. He has a goonish reputation and his penalty minutes this year support it. Though it’s worth noting that Brent Burns is second on the team in penalty minutes, it’s even more shocking that Scott places third on the team despite playing in just 22 games.
Scott has played in less than half of the games this season, but has racked up 44 penalty minutes, averaging two per game. The two skaters ahead of him in the category, Burns and Andrew Desjardins, have skated in 51 and 48 games respectively. No one else on the team even comes close to that average and it’s a mystery why Todd McLellan continues to play somebody who offers so little to this club. He has also managed to get suspended twice this season.
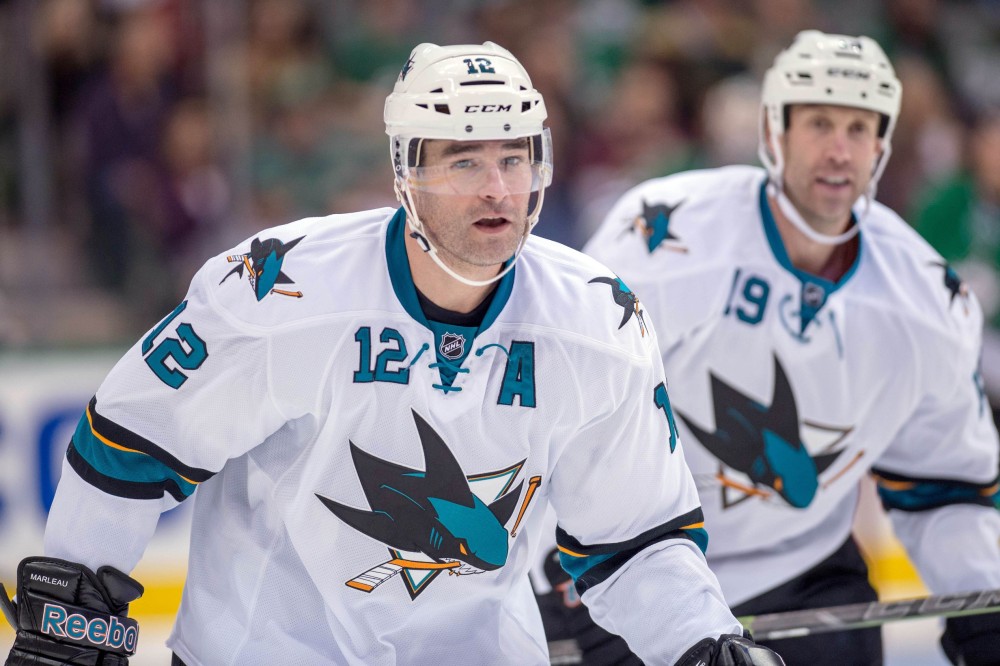
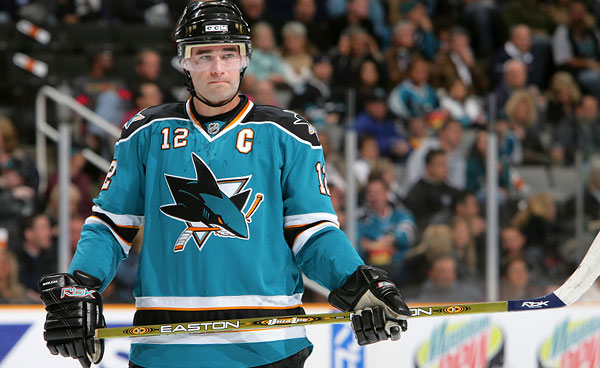
Patrick Marleau’s +/-
To put it simply, Patrick Marleau is having a rough year. He has just ten goals in 51 games, and possesses a depressing 6.5% shooting percentage. He is also last on the team in plus-minus.
Marleau is a minus-10 on the year for a number of reasons. His shooting percentage is well below his career average and he has spent the majority of the season on a second line that has been ice-cold at times. Bounces have not been going his way and his stats are paying for it. Fans can only hope that the former captain’s goal differential improves soon, because having a star player like Marleau perform like this in the postseason could cause serious problems for the team. Hockey gods, please help this man.
It IS a total mystery why TMc plays someone who offers so little to the club.
Sharks record with John Scott in the lineup…14-5-3
without John Scott…13-12-4
It must be nice being a guy like, say, Pickles, and know that if a guy like, say, Tim Jackman were to come mess with you that John Scott would go out, grab said Jackman, and explain to him why that was a very bad idea. Not that something like this would ever happen.
Ummmm yea about Marleau , you may want to note he has had more game winning goals than anyone on the team, and in post season he is I believe number two, active. You may want to appreciate his absurd skills on the pk where he is a threat for a shorty and often will burn 15 or more seconds of the opposing teams PP because unlike a certain # 19 it takes more than a schoolgirl to remove the puck from him, you will note also Jumbo is nowhere to be seen on the PK cause you can’t trust him .
Marleau has been a great player and if you want to pay him close to $7mil a year to lead the team in minus, well, I’m guessing you’d be pretty close to alone on that. Thing is, TMc is misusing Marleau. He does have considerable skill, but he isn’t — and hasn’t for a few years now — been the guy that should get huge ice time. Marleau is probably a 15-17 minute a night player at this point — beyond that, I think you see rapidly diminishing returns. No shame in that. I wish TMc would look at what Gregg Popovich has done in San Antonio, where he routinely gives his premier players (Duncan, Parker, Ginoubli) less playing time in order to keep them fresh for the postseason. A lot of championships in San Antonio, in part, because the coach doesn’t burn his top guys out.
ran some more interesting numbers on Marleau:
Patrick Marleau, first 10 games of the year (last 4 years)
2014: 4G 8A +1
2013: 8G 4A +5
2012: 9G 5A +2 (actually in Jan/Feb 2013 due to strike)
2011: 2G 6A +6
That is 1.1ppg and +.035 per game. Elite numbers, over 82 games, 90 points and +29
After 1st 10 games:
2014/15: 6G 18A -11 (41 games)
2013/14: 25G 33A -5 (72 games)
2012/13: 8G 9A -4 (38 games due to strike)
2011/12: 28G 28A +4 (72 games)
0.70 ppg and -0.07 per game. Huge drop-off. Over 82 games, 60 points and a -6.
If you look only at the last 3 years, its worse. 98 points in 151 games or 0.65ppg or 53 points over 82 games. And roughly -11 per 82 games.
Why hasn’t Sharks mgmt figured this out? Marleau runs hot when he’s well rested, runs cold when he’s overplayed. Doh!!
I agree. He should be rested and his ice time should be reduced coming down the stretch of the season. Utilize him. I’ve played hockey my whole life and I always played my best when I was well rested. It’s just common sense, we are humans, not robots.
As for Karlsson, what a great find. And while he had to earn his way up there, when you are on the same line with Joe Thornton, good things do tend to happen. See: Pavelski, Joe for what can happen to your goal scoring totals when lined-up with Jumbo.
The Marleau thing is really problematic. Which might beg the question: If he’s not playing well, why is he 15th in the entire NHL in TOI per game among forwards? And only 9 of the forwards ahead of him have more TOI for the year, as they’ve missed games and Patrick hasn’t. Shouldn’t a guy who leads the team in minus — get less time our there, not more?
In response to Andrew a win in Calgary should get the Sharks going but it’s not going to be easy, the Flames have the chance to bump the Sharks down the standings starting tonight and I am sure the Sharks are aware of this at this point in the season. Something that has historically, cause them to choke.
With the unpredictable state the Sharks are in right now, this article has me thinking – what would it take for the team to get back to the consistency and reliability that it used to be at? I’m no hockey expert, but as a SJ local / engineer, these numbers are astounding compared to previous statistics.