Who flinches first?
The Los Angeles Kings and San Jose Sharks are set to collide again this Thursday, the third time in four years that the I-5 rivals will play playoff chicken.
The shared history between the franchises has manufactured numerous storylines. Over the next couple weeks, you’ll be hearing them over and over again. However, some of these stories are just that, stories.
The Kings and Sharks have weak power plays.
While the Sharks finished 20th and the Kings 27th in league power play percentage, underlying numbers suggest that both teams are due for a surge. Let’s start with San Jose:
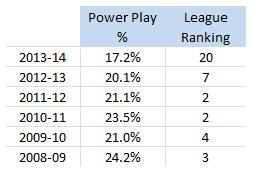
Case closed, the vaunted Sharks power play is in decline? Look again:
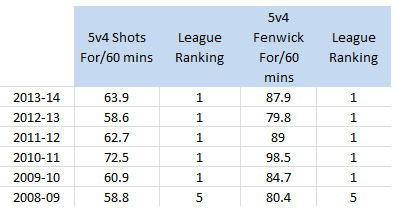
(Fenwick For/60 mins measures unblocked shots for when a player or team is on the ice per 60 minutes of ice time.)
For the fifth consecutive year, San Jose leads the NHL at getting 5v4 shots through. Their power play is more or less as dangerous as ever. Bad luck—or an unreasonably low 9.6 5v4 shooting percentage (27th in NHL)—won’t last.
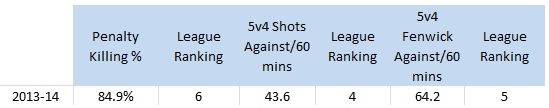
So Los Angeles must exert discipline. But besides being short handed on 296 occasions this season (28th in NHL), the Kings PK unit isn’t quite as strong as its league ranking indicates:
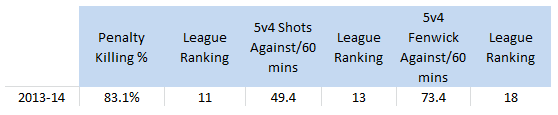
(Fenwick Against/60 mins measures unblocked shots against when a player or team is on the ice per 60 minutes of ice time.)
As for LA’s power play, it enjoyed a drastic and possibly real improvement with the acquisition of Marian Gaborik.
Of course, giving just one player all the credit is unfair—better luck and a regular shift for Alec Martinez also helped the team’s production:
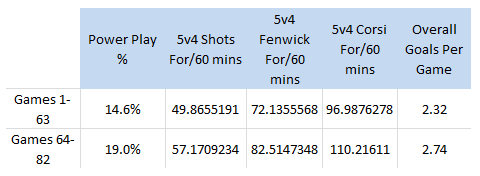
(Corsi For/60 mins measures blocked + unblocked shots for when a player or team is on the ice per 60 minutes of ice time.)
For what’s it worth, San Jose has only been short handed 219 times (best in NHL). Brent Burns has the most minors on the team with just 17; Drew Doughty “paces” Los Angeles with 32. The Sharks are also relentless on the kill:
20-1-1.
That’s the home record, including playoffs, in Kings-Sharks games over the last three seasons.
Home ice matters—but not that much.
There were 10 straight one-goal games at the SAP Center in that stretch; LA lost nine of them. That won’t last. The Kings have also pulled out the 5v5 Fenwick Close possession battle in most games:
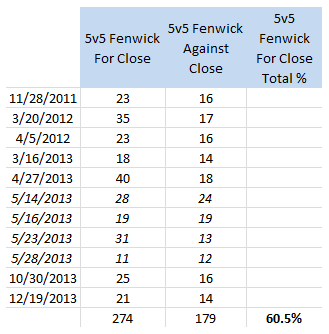
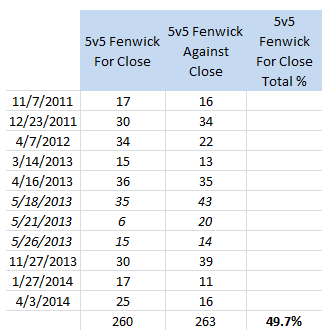
(Fenwick Close For/Against measures unblocked shots by a player or team in “close” game situations where the score is tied in any period or within one goal in the first or second periods. This helps remove score effects, which are the result of a team in a defensive shell or gambling to score goals.)
Los Angeles is miles ahead of San Jose at home and neck to neck on the road. An away team, most likely LA, will come out of this series with a win or two.
Jonathan Quick gives the Kings a clear edge.
Antti Niemi struggled this year with a .918 5v5 save percentage (23rd out of 25 goalies with over 41 games played) and hasn’t even received the Game One starting nod yet. Quick endured another rocky regular season, but since the Olympic break, has posted a .931 5v5 save percentage (which would be 6th in the NHL).
However, assuming Quick, because of his .940 save percentage over the last two postseasons, will be just as good, is forgetting his earlier playoff flameouts (.900 save percentage over 2010 and 2011). Assuming Niemi will falter because of a rough regular season and career .909 playoff save percentage is forgetting his well-earned Stanley Cup ring.
Both goalies have been tripped up by unevenness; both are also playoff-tested. In a series this evenly matched, both skate an equally thin tightrope.
Final thoughts.
The great center battles don’t happen in the NBA anymore, but are still very much part of the NHL. Keep an eye on which team can best contain Anze Kopitar or Joe Thornton. Also, look for Coach Todd McLellan to mismatch Thornton against the smaller Mike Richards as much as possible.
Marc-Edouard Vlasic will earn much-deserved Norris Trophy votes. However, is he a true number-one defender or just the best on a team whose former top dog, Dan Boyle, has grown long in the tooth? He faces a stiff test of his bona fides in Kopitar, who has dominated him recently. As for LA, fans will have their eyes trained on lightning rods Jake Muzzin and Robyn Regehr. However, the Kings defenseman to watch is their second most-used and second-best paid, Slava Voynov. Is he capable of being the number-two of a championship squad? V is for validation this postseason.
Stats courtesy of Behind the Net, Extra Skater, Hockey Analysis, Hockey Reference, and Sporting Charts.
Comments are closed.