UPDATE: This was written before the 2019-2020 NHL season was postponed to help prevent the spread of COVID-19. All information below is still accurate, and we hope the virus will be under control soon. I’d like to wish the best to all readers during these trying times.
Related: Maple Leafs – Whipping Boys from the Last Decade
The Toronto Maple Leafs are in a funny situation. They handily beat one of the NHL’s best on Tuesday night, the Tampa Bay Lightning. Yet, immediately before that, they lost three straight on their California road trip against some of the NHL’s worst.
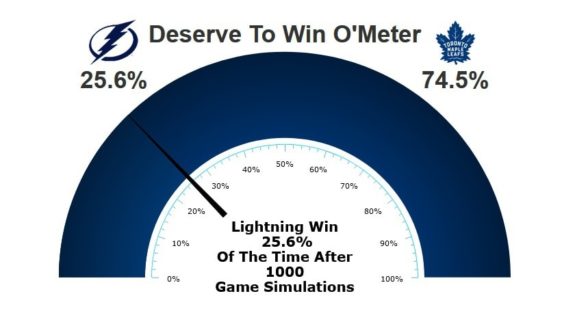
Looking ahead, if the Maple Leafs do make the playoffs this year, their first opponent will likely be the Lightning. Many fans can rejoice that the Maple Leafs will avoid the heartbreak of another Game 7 loss to the Boston Bruins in the first round, but will the Lightning be any easier?
In this piece, I will do a deep dive into both teams, comparing their strengths, weaknesses, rate of play, and more as they into the first round of the playoffs. This should give us a rough idea of where the Maple Leafs stand against the Lightning.
Related: Tampa Bay Lightning’s 50-Goal Scorers
Note that, regardless of what is said below, anything can happen in the NHL Playoffs!
Traditional Statistical Comparison
Here is a comparison of the two teams using traditional stats: goals, shots for and against, power play and penalty kill, etc.
| Toronto Maple Leafs | Tampa Bay Lightning | |
| Goals for per game | 3.39 | 3.47 |
| Goals against per game | 3.17 | 2.77 |
| Power play percentage | 23.1 | 23.2 |
| Penalty kill percentage | 77.7 | 81.4 |
| Shots for per game | 32.9 | 31.1 |
| Shots against per game | 31.9 | 30.9 |
| Face-off win percentage | 52.5 | 50.5 |
The Lightning edge out the Maple Leafs in goals per game. The Maple Leafs, however, have a slight edge in shots on goal per game. Over many games, they teams are basically equal. Also, their power plays differ by only 0.1%, with the Lightning having a slight edge.
Defensively, the Maple Leafs are the better team at face-offs by 2%. They also allow 0.4 more goals per game compared to the Lightning, but only a single shot more on average. These extra goals per game are basically due to poor goaltending the team has received for most of the season.
Related: What Mats Sundin Meant to Toronto Hockey
The Maple Leafs’ penalty kill is 3.7% worse than the Lightning over the entire season. However, if you look at the post-Babcock penalty kill numbers, they are much closer.
The Maple Leafs take almost two minors less per game than the Lightning, but the referees will be interested in keeping penalty calls even in the playoffs, so this will hardly matter.
In terms of injuries, the Maple Leafs are expecting Ilya Mikheyev and Jake Muzzin to return in the coming weeks. However, they will be without Andreas Johnsson for the remainder of the season.
The Lightning, on the other hand, are expected to be without Steven Stamkos for the first round. Jan Rutta has also been out with an injury since early February, and there’s been no update on his expected return.
The Maple Leafs have the advantage on the injury front, barring any others.
Advanced Statistical Comparison
Here, I only used Maple Leafs under Sheldon Keefe, as their play is fundamentally different from the Babcock Maple Leafs.
| Toronto Maple Leafs | Tampa Bay Lightning | |
| 5v5 shot attempts for per 60 (CF/60) | 58.74 | 56.85 |
| 5v5 shot attempts against per 60 (CA/60) | 55.68 | 51.95 |
| 5v5 expected goals for per 60 (xGF/60) | 2.59 | 2.4 |
| 5v5 expected goals against per 60 (xGA/60) | 2.33 | 2.07 |
| Power play expected goals for per 60 (PP xGF/60) | 6.31 | 6.24 |
| Penalty kill expected goals against per 60 (PK xGA/60) | 5.5 | 6.28 |
| Starting goalie 5v5 goals saved above expectation | -11.43 | -5.61 |
| Starting goalie penalty kill goals saved above expectation | -2.1 | -3.75 |
The Maple Leafs generate more shot attempts for, more expected goals for at both 5v5 and on the power play, and limit expected goals against on the penalty kill better than the Lightning. The Lightning limit shot attempts and expected goals against better at 5v5.
The Lightning’s starting goalie, Andrei Vasilevskiy, has outplayed the Maple Leafs’ Frederik Andersen all season while still being slightly below average. On the other hand, Andersen has performed slightly better while the Maple Leafs are on the PK.
In two recent head-to-head meetings, the Maple Leafs had an all situations expected goals for percentage (xGF%) of 51% on Feb. 25 and 64% (!) on Mar. 10. In the playoffs, we will likely see more games like the one on Feb. 25.
Realistically, these two teams are very close statistically. The Maple Leafs generate more offence, while the Lightning are slightly better defensively. In the playoffs, especially coming off a (potentially extended) break, who knows which team will have the edge?
A first-round series between the Maple Leafs and the Lightning would be a very close one, based on what’s outlined above. The Maple Leafs have shown that they can hang with the Lightning this season. The question is, can they hang for an entire series?