
In the final portion of reviewing the Monte Carlo results from the four divisions it’s time we focus on the NHL’s favourite: the Metro Division. As a reminder we use Monte Carlo to make predictions and determine probabilities on the final rankings for each team. The Metro Division itself does not contain very many good teams; similar to the Atlantic Division the Metro is top heavy which could make an interesting race for the wildcard positions come spring.
As a reminder, the Monte Carlo uses Score-Adjusted Corsi, to model the strengths of each team, research from my thesis, and random numbers to iterate over the remaining schedule over 10,000 times to come up with the probabilities. This information is based on what we know about the teams and major change ups, such as injuries, trades, and a high PDO run, can affect the final results.
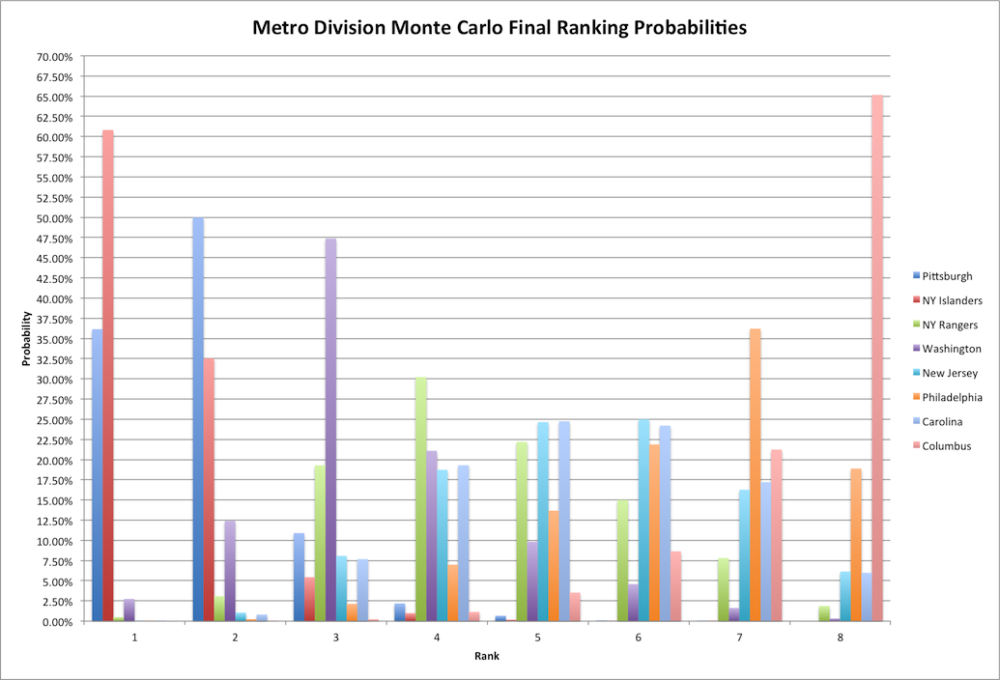
Let’s look at the Metro Division.
New York Islanders
| 1 | 2 | 3 | 4 | 5 | 6 | 7 | 8 | |
|---|---|---|---|---|---|---|---|---|
| NY Islanders | 60.82% | 32.53% | 5.44% | 0.99% | 0.18% | 0.02% | 0.02% | 0.00% |
The New York Islanders are currently sitting at the top of the Metro Division with 38 points through the first 26 games. Combined with the fact they lead the Metro Division in the analytics standing at 53.3% Scored-Adjusted Corsi (SAC) good for 6th in the league. Despite their success they have been slightly on the “unlucky”, with a 99.8% PDO, side thanks to a low shooting percentage while their save percentage has been helping them. All in all their success should lead them to take the division title, with over a 99% chance of making the playoffs, a great turn around for the Islanders.
Pittsburgh Penguins
| 1 | 2 | 3 | 4 | 5 | 6 | 7 | 8 | |
|---|---|---|---|---|---|---|---|---|
| Pittsburgh | 36.15% | 49.98% | 10.90% | 2.19% | 0.67% | 0.09% | 0.02% | 0.00% |
The Pittsburgh Penguins have seen a huge drop in their analytics this week as their possession numbers have dropped the Penguins from 4th best to 9th best, an area of concern that Penguin fans should be watching out for. Their 52.7% SAC, combined with their league second-highest PDO at 102.5% greatly in part of the goaltending, currently has placed the Penguins at 2nd in the division with 36 points in 25 games. They have over a 98% chance of making the playoffs but will most likely finish in second.
New York Rangers
| 1 | 2 | 3 | 4 | 5 | 6 | 7 | 8 | |
|---|---|---|---|---|---|---|---|---|
| NY Rangers | 0.50% | 3.09% | 19.29% | 30.23% | 22.19% | 15.00% | 7.81% | 1.89% |
The New York Rangers have had a good start to their year with with their goalies and their shooting percentages above average. This has earned the Rangers third place in the division with 26 points in 24 games. Don’t expect those variances to continue as the Rangers are ranked 18th in the NHL with 49.9% SAC. This will likely see the Rangers become bumped down to 4th place with a 41% chance of making the playoffs.
Washington Capitals
| 1 | 2 | 3 | 4 | 5 | 6 | 7 | 8 | |
|---|---|---|---|---|---|---|---|---|
| Washington | 2.75% | 12.41% | 47.38% | 21.09% | 9.83% | 4.58% | 1.63% | 0.33% |
The Washington Capitals are sitting in the middle of the division and are doing that surprisingly while seemingly being not able to score. Their current shooting percentage is 7.5% and with a team that employed Alexander Ovechkin that is sustainable low. The Capitals are the 10th best possession team with 52.5% SAC and this should see Washington jump in the rankings. The Capitals haver over a 76% chance of making the playoffs with their most likely finish at 3rd.
New Jersey Devils
| 1 | 2 | 3 | 4 | 5 | 6 | 7 | 8 | |
|---|---|---|---|---|---|---|---|---|
| New Jersey | 0.08% | 1.06% | 8.08% | 18.74% | 24.64% | 24.99% | 16.27% | 6.14% |
After years of being an excellent possession teams the New Jersey Devils have taken a massive tumble down to 19th place with a 49.8% SAC. Thanks to the excellent play of goaltender Cory Schneider the Devils have been out-performing their true talent with a 100.9% PDO. Expect the Devils to miss the playoffs, with a 20.79% chance of earning a playoff seed; their most likely finish will be 6th in the division.
Philadelphia Flyers
| 1 | 2 | 3 | 4 | 5 | 6 | 7 | 8 | |
|---|---|---|---|---|---|---|---|---|
| Philadelphia | 0.01% | 0.25% | 2.14% | 6.99% | 13.68% | 21.88% | 36.21% | 18.89% |
The Philadelphia Flyers are another team to start the season with an extremely low PDO thanks in part to their difficulty in converting their shots to goals. Combined with a league ranking of 23rd in Score-Adjusted Corsi, at 47.8%. These two factors give Philadelphia only a 6.16% chance of making the playoffs with the Flyers most likely finishing as the 7th seed.
Carolina Hurricanes
| 1 | 2 | 3 | 4 | 5 | 6 | 7 | 8 | |
|---|---|---|---|---|---|---|---|---|
| Carolina | 0.06% | 0.82% | 7.68% | 19.30% | 24.74% | 24.21% | 17.21% | 5.98% |
Columbus is surprisingly decent team for where they are sitting in the division standings. Currently the Hurricanes have only 19 points and 8 wins in 25 games despite ranking 16th in possession at 50.3%. The reason they have been performing so poorly is for the same reason as the other teams in the Metro: their inability to convert shots to goals. Currently the Hurricanes are shooting at 6.56%, a number surely to improve as Carolina gets back its healthy bodies. The Hurricanes currently have a 20.31% chance of making the playoffs and will likely finish in the 5th seed.
Columbus Blue Jackets
| 1 | 2 | 3 | 4 | 5 | 6 | 7 | 8 | |
|---|---|---|---|---|---|---|---|---|
| Columbus | 0.00% | 0.02% | 0.24% | 1.15% | 3.53% | 8.64% | 21.25% | 65.17% |
The Columbus Blue Jackets have been the team most effected by injuries this season and it reflects in both their traditional numbers and their advanced statistics. The Blue Jackets are sitting dead last in the division with 18 points and 8 wins in 25 games. They are posting a 45.7% SAC, good for 27th in the league, combined with 97.6% PDO. Their playoff chances are basically non-existence at this point, with a 0.61% of seeing the Stanley Cup Playoffs, and are all but guaranteed to finish 8th in the division, rather, Blue Jacket fans should be looking at the McDavid sweepstakes.
Final Rankings
The likely final standings within the Pacific Division should be as follows:
- NY Islanders
- Pittsburgh
- Washington
- NY Rangers
- Carolina
- New Jersey
- Philadelphia
- Columbus
I think it might be interesting if you posted a scatter of where the iterations of each Monte Carlo simulation rank each team. It might be a bit confusing for the average reader, but when I see results of a simulation, Im less interested in the point estimate and more interested in the degree of uncertainty/variability around that estimate.
Sam, it says right in the freaking article that injuries and such can affect the final rankings. Read it before you criticize it. I’m sure the author of this article would take you to town on your bridge sale.
The Pittsburgh Penguins have seen a huge drop in their analytics this week as their possession numbers have dropped the Penguins from 4th best to 9th best, an area of concern that Penguin fans should be watching out for….
Uh..the Pens have 6 of their top 4 wingers out along with Legang and the 2 game suspension for Bortz. . Kind of skews the recent drop a bit doesn’t it?
Statistics drawn in this manner are obviously flawed.
This is why i don’t follow these new analytics. You actually picked the islanders to finish first in the division. While they currently have a good run going, injuries and other intangibles will effect the team over the course of a season. If you really believe that your numbers are that stable, i have a bridge for sale with your name on it.