For the third consecutive year, some of the best analytical minds in the sport gathered in Ottawa for the annual hockey analytics conference on May 6. Although advanced stats have been slow to catch on with the majority of hockey fans, Saturday’s conference was further proof that there exists a small but passionate community dedicated to the advancement of analytics in hockey.
The conference was more than just a debate surrounding the merits of Corsi vs Fenwick – in fact, neither stat was discussed in any great detail – but instead focused on finding even newer ways to look at the game. From individual player evaluation to stat-based strategy at the draft and everything in between, the conference offered something for every hockey fan.
Putting the I in Team
Hockey is very much a team sport – some in the game contend it is the ultimate team sport – but relies so much on the contributions of individuals. So, naturally, some of the first speakers wanted to find ways to evaluate the performance of individuals independent of their teammates, as well as the impact of individuals on their team’s performance.

One of the first speakers, Micah Blake McCurdy (Hockeyviz.com), proposed a new way of evaluating goalies that put less emphasis on the team in front of him and adds more context. “How can we compensate for the fact that not every goalie plays in front of a team or defencemen who clear the puck at (better than league average rate)?” was his main question.
To put it simply, McCurdy proposed a method of evaluating goalies that puts them on the hook for anything that happens as a result of a shot (giving up a rebound, freezing the puck, causing a puck battle or allowing a goal) but doesn’t punish him for events he has no control over (his team’s inability to clear the puck or take possession in the neutral zone).
McCurdy’s method would not only allow for goalies to be evaluated individually for the things they can control, but also be contextualized relative to other teams for the things they can’t control. In other words, if goalie A (whose team is below average at clearing the puck) played on goalie B’s team (which is above average at clearing the puck) what would the effect be on goalie A?

Following McCurdy was Sophie Jablansky, a doctoral student at the University of Maryland, who presented her findings based on a simple question: How does a team’s playing style affect the success of its players?
What she found was that style of play had more of an effect on scoring chances and points scored when a team was at even strength or shorthanded, but not on the power play. To explain this, she suggested that teams are likely to employ different strategies when playing five-on-five or down a man, but that most teams have a similar strategy when on the man advantage.
What she also found was that, on a more individual level, time on ice (TOI), scoring chances and positioning were likely to affect a player’s point totals. Although it was difficult to confirm, she noted that positioning and TOI could be tied to a player’s skill level or role on the team, and thus could have a significant influence on scoring chances and points.
“It’s a small group who are passionate”
One of the most interesting subjects addressed was that of women’s hockey and how analytics and data play into the women’s game. It’s no secret women’s hockey severely lags behind the men in terms of fan support and media attention, and that fact has had a trickle-down effect on the quality of stats available to fans and reporters of the National Women’s Hockey League and the Canadian Women’s Hockey League).
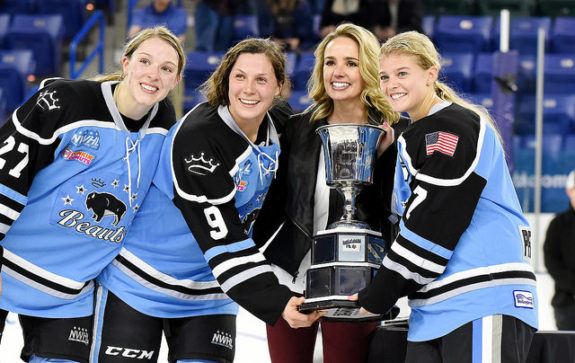
“The best we have is plus/minus, which is frustrating,” said writer Kate Cimini. “We don’t even have time on ice. It’s a question of money and fan investment and fans aren’t really looking for stats. It’s a small group who are passionate.”
NWHL commissioner Dani Rylan, who skyped into the conference later in the day, admitted her league had some difficulty tracking even basic in-game stats in the early going. It’s “tough to do so with such a lean staff as we had,” she said.
What has resulted, at least at the collegiate level, is that teams are keeping track of their own stats in the absence of a third party doing so. Britni Smith, assistant coach of the Clarkson University Women’s hockey team, noted their team tracks such things as scoring chances on the power play and off the rush, as well as chances by period, to determine why the team is getting chances at particular moments in the game.
As mentioned, Rylan joined the discussion to not only discuss the role of stats in the NWHL but also the challenges of getting a women’s league off the ground and keeping it running. The first, and biggest, challenges she said were finding rinks to play in, filling the rosters with enough competitive players and getting people to buy in to the league.
With the league just finishing its second season, her parting message to women interested in the game was simple – apply. She said there are close to twice as many men as women who apply to internships and coaching positions, and that getting women involved is the best way to ensure the women’s game continues to grow and that women in general continue to be a big part of the sport.
Corey Pronman and Data at the Draft
The Entry Draft is a sore spot for some fan bases, who lament their team’s consistent bad luck, and a source of celebration for others who revel in their team’s ability to find those steals. But Corey Pronman, a prospect writer for ESPN, succeeded in dispelling both notions in doing some deeper research of draft classes going back two decades.
After analyzing the data, he determined there was no way to tell if teams were consistently good or bad at the draft table based on their results. Instead what he found was there was “so much randomness in the draft” and that only about 25 percent of success at the draft was a result of skill on the part of scouts and other developmental staff (sorry, Detroit Red Wings fans).
In addition to looking at the effects of luck vs. skill at the draft, Pronman studied the effects of having a late birthday (being born after the Sept. 15 deadline for each respective draft class). He determined that players with late birthdays were over-drafted in their draft class despite often being outperformed in their age-18 seasons.
Timo Seppa from Hockey Prospectus then presented his findings of a text-based analysis of scouting reports that grouped players with similar attributes to find common threads between such players. His findings showed that generally speaking, undrafted players were more likely than drafted players to have good physicality, net drive and puck battles, among other attributes, listed in their scouting reports.
Continuing a common theme of the day, both Seppa and Pronman found that scouts were better at predicting some elements of the game (busts, for example) and stats better at predicting others (player performance), but that each approach worked best when used in conjunction with the other.
Taking a Gamble
The final presenter of the day was one of the conference’s co-creators, Rob Vollman, who led a discussion centred around this June’s expansion draft for the Vegas Golden Knights. The first challenge he noted was choosing how to evaluate the available players to get a better gauge on their value.

“You need a way to summarize a player’s contributions in one number,” he said. But he cautioned that such a number, while a good starting point, was too limited in scope and only showed how good a player was in a given year, not how good the player has been or will be in the future. The best way to do that, he said, was to track how a player’s production changed from year-to-year.
His final roster reflected the main ideal surrounding his picks, which is that Vegas should pick the best assets (i.e. contracts) and not necessarily the best available players. Ultimately, he and the rest of the experts tasked with filling out their own expansion rosters determined the Golden Knights likely won’t finish last, will struggle to score, have a fairly solid defence corps and hold a slim possibility of making the playoffs.
Best of the Rest
One of the few presentations that didn’t look at individuals but more so the collective was provided by SMT “(the yellow line company,” known best for superimposing the first down line on NFL broadcasts). They used their 3D puck-tracking technology during last year’s World Cup to track shot types and precise shot locations and got a plethora of data.
Using this tech, they were able to measure the speed of various shot types (slap shots vs. wrist shots), though it was difficult for the technology to differentiate between wrist shots and snap shots. They also found that shot angle had a significant impact on shooting percentage, showing that lifting the puck increased shooting percentage by 1.5 to two times that of a shot along the ice.
Popular choices from #otthac17 mock expansion draft pic.twitter.com/M5Yl7uf4pp
— Michael Schuckers (@SchuckersM) May 6, 2017
Some of the other features SMT presented included the ability to track the quantity and quality of screens, as well as the quality and danger of shots and the ability the evaluate the type of shots being blocked. Each of these has exciting applications for the NHL, especially the latter which could add some context to a stat many in the analytics community are wary of.
While blocked shots are often used as a measure of defensive ability, Matt Cane of WinnersView proposed an alternative method of evaluating defensive ability by looking at passing data. Cane and his team found seven common pass types after analyzing the data, with cross-ice passes (what they call Royal Road) being the most effective in leading to goals.
Although they weren’t able to make too many generalizations, they found that players and teams who performed well in possession-based metrics tended to perform worse in expected goals off of passes, while the opposite held true of poor possession players. One example he used was that of Cody Ceci, who has a poor Corsi For percent but also a low expected goals rating.
What’s Next?
Almost all of the presenters acknowledged the limitations of their research, leaving the door open for expansion or a complete overhaul. Perhaps by the time next year’s conference rolls around, their work could be that much further or along, or maybe there will be new areas to explore.