Over the past few years, I’ve looked for clues in the NHL’s regular season that act a strong predictor for the postseason.
For those involved in this quest, it’s mostly a case of ‘misery loves company.’ Before the playoffs, I reviewed this article summarizing three detailed predictions, including the odds for each team.
The predictor and their top five predictions were:
Money Puck: Washington, Boston, Minnesota, Montreal, San Jose (none of final four)
Don’t Tell Me About Heart: Minnesota, Anaheim, Boston, Washington, Montreal (one of final four)
hockeyviz.com: Washington, Anaheim, Minnesota, Montreal, Pittsburgh (two of final four)
In all three cases, many of their picks to go deep were, instead, gone in Round 1. Of the six total forecasts for Nashville and Ottawa, five had them gone in the opening round. Two had Ottawa dead last in their rankings. Yet, both made it to their conference final and Nashville to the Stanley Cup Final.
https://twitter.com/DTMAboutHeart/status/851537758694887425
I’m not being critical of these predictions. Getting it wrong is the norm for those forecasting the Stanley Cup Playoffs. I don’t make predictions, but it’s doubtful I’d fare any better.
Previously, I’ve argued regular season records have little to do with playoff success. Make the playoffs and you’ve got a genuine shot. Regular season point totals can essentially be tossed out. All those clichés about critical points, unless the points are the difference between making and missing the playoffs? Forget about them.
A Different Approach
I’ve taken a different approach to forecasting the playoffs, and the results are equally maddening. I’ve looked at when teams play their best in the regular season, looking for a correlation to playoff success. Though I didn’t create a formal hypothesis, it’s fair to suggest there were certain correlations I’d hoped to see. In particular, I wondered if teams that played very well late in the season were more likely to see playoff success.
Biases and Caveats
There is a bias towards good teams having better records late in the season. As teams fall out of contention, they often change their priority from winning games to developing players. This means increased ice time for younger players, including those getting their first taste of the NHL. Productive but injured veterans shut it down early, allowing themselves more recovery time.
Furthermore, teams make trades in late February before the trade deadline. The approach is simple: non-contenders give up some of the present for a better future, weakening the team for the rest of the season. Contenders make themselves stronger by acquiring players who help them for the rest of the season.
There should be an upward trend for playoff teams as the non-playoff teams change their focus.
If better teams rise towards the end of the season, it may not be because the top teams were peaking, but because weaker teams deliberately became less competitive. All the better teams would rise under this scenario, not just the eventually Stanley Cup finalists. Teams should see an uptick, as lesser teams deliberately fade.
Separating out this bias is difficult. Alas, as we’ll see, the data makes the case this isn’t necessary.
The Data Details
The data covered the last seven full seasons. I took the records, by month, of each Stanley Cup finalist. The metric I used was points per game (PPG) for each calendar month. This provided 14 seasons’ worth of mostly uncooperative data. I used data for each month from October to March. This provided a potential 84 total data points, but I removed February data in Olympic years (2010 and 2014) because too few NHL games were played, reducing the dataset to 80 ‘team-months’.
Since February is only accounted for in five of seven seasons, where appropriate, I normalized February data by adjusting its numbers proportionately.
I excluded April for reasons I cover in the notes below.
To make parts of the analysis easier to understand, I normalized the numbers to an 82-game season.
Lastly, the 48-game lockout season (2013) was excluded from the data.

Perhaps the team that best illustrates the unwillingness of the data to align is the 2010-2011 Boston Bruins, the eventual Stanley Cup winners. They had their best month in October (1.50 PPG), their worst month in November (1.00 PPG) and their second-best month in December (1.36 PPG). Using normalized numbers, they played at a 123-point pace in October, an 82-point pace in November and a 112-point pace in December.
Stanley Cup Chaos!
The big winner in the results was chaos. There were no strong trends.
I looked at the average points per month over all 14 team-seasons (seven teams, two teams per season). These are the months, in order from best to worst, with the number of points scaled to an 82-game season:
- March (104.0)
- February (103.5)
- November (103.4)
- January (102.2)
- December (100.1)
- October (97.8).
The first thing to note is that every month generated a point total that fits a mid-tier playoff spot. Nowhere close to a Presidents’ Trophy, but always in the playoffs with at least some room to spare.
The three top months formed a virtual dead heat. March, February, and November were separated by 0.6 points. Essentially indistinguishable. January was less than two points back of the leader, at best a very slight distinction. Only October, the month furthest removed from the playoffs, stood modestly apart.
I cut the data another way, looking at the two best months each team had in the season. Again we see a relatively flat result.
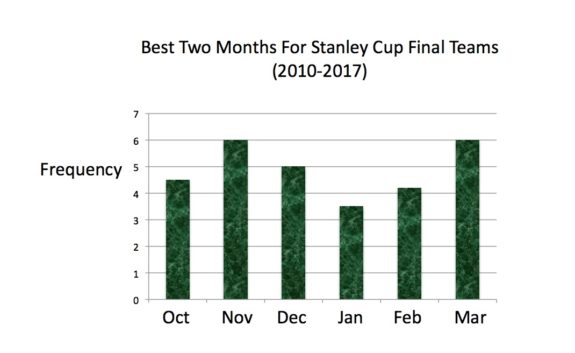
My hunch was February would shine in these analyses. It is the month teams decide if they are contenders or not. It is when mettle gets tested, the cream rises and metaphors suffer. As it turned out, February was similar to almost every other month.
Hitting Bottom
OK, so the ‘best month’ approach didn’t work out, but perhaps teams had a common worst month.
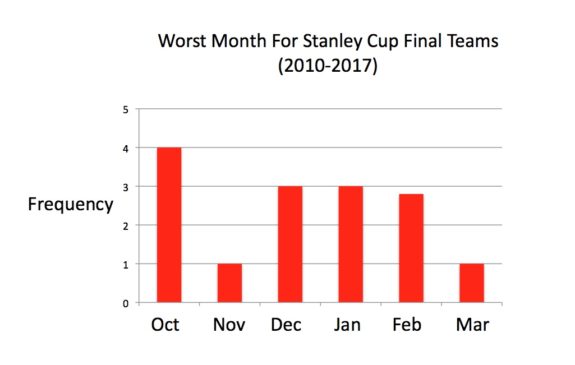
Worst-month data also proved uncooperative. Among the worst months, March and November had one each. Not surprisingly, October led the pack.
Three teams, Pittsburgh this season, Vancouver in 2011 and Tampa Bay in 2015, had a ‘worst month’ while still averaging better than a point per game. Every other team had a worst month at or below a point per game. The 2010 Philadelphia Flyers and this season’s Nashville Predators each had two months below a point per game.
Strange Surprise
If there was a surprise, it was an anomaly.
Playoff success and success in the Olympic month seemed to go together. The sample size is small, just 22 games (spread out over four teams), but the teams managed 31 points, a rate of 1.41 per game. This pace normalizes to 116 points for a full season, 14 percent better than non-Olympic Februarys.

When the unusual hits, one often finds mature teams with quality coaches adapt effectively. The Washington Redskins won Super Bowls in the last two NFL strike seasons. Their coach, Joe Gibbs, is among the best in league history. When the NHL had its lockout-shortened season in 2013, the team taking advantage was Chicago. The coach, Joel Quenneville, is also among the best in league history and his team was filled with players with Stanley Cup-winning experience.
While the data is thin, atypical seasons (Olympics, lockout) may give certain teams an advantage.
Lacking Conclusions
Finishing an analysis without a strong conclusion is not how stories are supposed to end. Yet there is value in eliminating variables and moving on to new hypotheses. The data suggests successful postseason teams evolve in many different ways over the course of the regular season. There is a good bit of month-to-month variation, but in the aggregate, there is no apparent formula.
In prior articles, we looked for correlations between the regular season standings and playoff success, and found almost nothing correlates. This time, we looked for trends within the season to see if there were correlations to playoff success.
After a lengthy analysis, we get another result saying the regular season has minimal bearing on which teams go far in the postseason. The good news in all this? It means the Stanley Cup playoffs remain as unpredictable as ever.
Zeke’s Notes
I debated on whether to include April in the data, eventually deciding against it. In the aggregate, April had enough games (68) to be statistically significant. Even so, there is reason to be leery of the results, since teams often play atypical rosters in April.
There are few games in April (roughly five per team) and several are meaningless, with no tangible advantage for winning or losing. Of the final four teams this season, only Anaheim played a meaningful game 82. Ottawa played one meaningless game while Pittsburgh and Nashville played two apiece. It’s also worth noting, even if the contender is playing a meaningful game, it does not mean their opponent is.
For the record, April normalized to 102.5 points over an 82-game season, essentially middle of the pack.