Since his first day in the NHL, Philadelphia Flyers fans have been comparing Sean Couturier to the player with whom he broke into the league: Brayden Schenn.
And even before Couturier broke into the NHL he was being hailed as the next great two-way center. The comparisons to perennial Selke trophy nominees were already there. Far and away the player who is most frequently compared to Couturier in this regard is Patrice Bergeron.
Both of these comparisons tend to cause more criticism to Couturier than an appreciation for his play. After an in depth examination of each comparison, I believe that a greater appreciation for Couturier can be established.
Brayden Schenn

Brayden Schenn and Sean Couturier broke into the NHL at the beginning of the 2011-2012 season and ever since then, their names have rolled off of the tongue together for Flyers fans.
Summer of 2012: “The Preds want our young guys, Schenn and Couturier, for Shea Weber”
Summer of 2013: “Sophmore slumps happen, but Schenn and Couturier are still the future of the team.”
Summer of 2014: “It’s only a matter of time before Schenn and Couturier break out.”
Summer of 2015: “What the Flyers really need is for Schenn and Couturier to take the next step.”
Although Schenn finished the 2014-2015 season with 10 more points than Couturier (47 to 37), they finished the season with almost identical even strength numbers. To juxtapose the even strength numbers of Couturier and Schenn from the 2014-2015 season, I created the chart below.
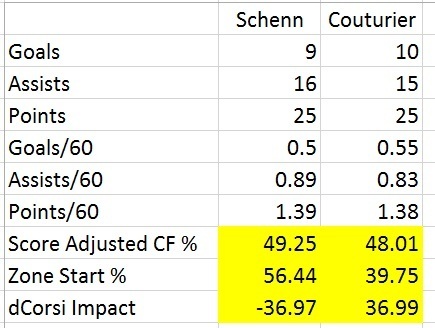
*All advanced metrics were gathered from war-on-ice.com. As I have said before, war-on-ice is a valuable resource to any hockey fan.*
The first six rows are self explanatory. They show that at even strength, Schenn and Couturier produced at an almost identical clip. It is in the advanced metrics that one can see just how much better Couturier actually was this past season. What do those last three rows mean? Let’s take a look.
Score Adjusted Corsi is the same as Corsi, except that it takes ‘score effects’ into consideration. Like Corsi, it is a measurement of the percentage of shot attempts for/against that happen while a player is on the ice. However, it is obvious when watching a game that the pace and style of the game change when one team is up or down by multiple goals. The team with the lead tends to revert to a more conservative style while the trailing team is more likely to take risks. Therefore, in lopsided games, the Corsi percentage for those players on the leading team tend to drop. Score Adjusted Corsi takes this into consideration, giving a more weight to those numbers accumulated when the score is close.
Zone Start percentage was discussed at length in Part One. This measures the number of offensive zone starts divided by the total of offensive and defensive zone starts. So, Couturier had 281 offensive zone starts and 426 defensive zone starts, while Schenn had 381 offensive zone starts and 294 defensive zone starts.
281+426=707, 281/707 = 39.75%
381+294=675, 381/675 = 56.44%
The stat named “dCorsi” was created by Stephen Burtch, and the stat can be found in the ‘Labs’ section of war-on-ice.com. The idea behind dCorsi is that it accounts for context. Burtch, a brilliant mind in hockey analytics, developed a model in which he measures “Expected Corsi For per 60” (ECF60) and “Expected Corsi Against per 60” (ECA60). These numbers indicate what would be expected from the average NHLer if given the same zone starts and teammates as the player in question. Then, Burtch inputs the actual ‘Corsi For’ and ‘Corsi Against’ of the player in question and matches it up against the Expected totals.
When all is said and done, a player is shown to either perform better (i.e. Couturier, +36.99) or worse (i.e. Schenn, –36.97) than their usage would suggest. Although this is complicated, it serves to illustrate the positive affect that Couturier has despite his poor usage. While conversely illustrating that Schenn seems to be wasting quality minutes. For a more detailed description of dCorsi, click here.
Ultimately, Couturier and Schenn produced equally at even strength this season. The fact that Couturier produced such numbers while being buried and Schenn produced them while being coddled should tell Flyers fans a lot. Don’t let Schenn’s sexier point total fool you, Couturier was the superior player in 2014-2015.
Patrice Bergeron
The comparison that seems to be thrown around most often, yet is the most frustrating, is that of Sean Couturier to Patrice Bergeron. The latest person to make this comparison was ex-Flyers coach Craig Berube.
Now, to be very clear, Couturier is no Bergeron. Not yet, anyway. How can Couturier become more like Bergeron? That discussion will be saved for tomorrow’s post. For now, I have created a chart that compares some of Couturier and Bergerons numbers.
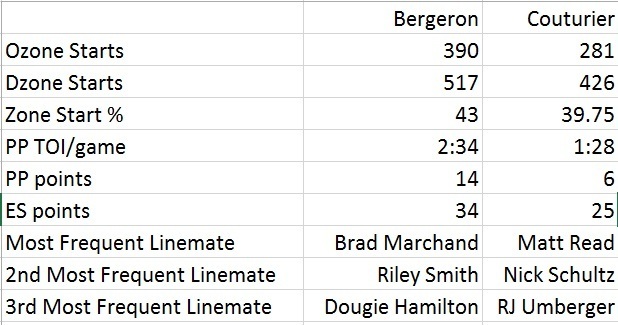
*The first six rows of stats are from war-on-ice.com while the linemates were found at behindthenet.ca.
Although Couturier and Bergeron are used similarly, it is hardly an apples-to-apples comparison. Bergeron started 109 more even strength shifts in the offensive zone than Couturier, yet he also started in the defensive zone 91 more times.
In terms of raw point totals, Bergeron’s 55 clearly outdo Couturier’s 37. But, Couturier was not as far behind at even strength. If given similar power play time, it is not out of the realm of possibility that Couturier could close the gap to Bergeron points-wise.

Finally, the “Frequent Linemates” section of that graph should be embarrassing to the Flyers brass. Matt Read spent half of the season with an ankle sprain. Nick Schultz showed in the final stretch of the season that his “solid defensive play” was more of a by product of Braydon Coburn than him actually being a top-four defenseman. RJ Umberger is a shell of the player he once was. He has been a possession nightmare for years and simply is not a quality NHL player anymore.
If given more consistent power play time, slightly improved zone starts, and a few skilled hockey players to help him out, it is not crazy to think that Couturier could become a Bergeron-type player.
Let us not forget that Patrice Bergeron has won two Selke Trophy’s, two Olympic Gold Medals, and a Stanley Cup. He did not accomplish any of those feats before the age of 25 years old. Couturier is still just 22.
Ultimately, when deeply investigated, Couturier stacks up better than expected to the players that he is frequently compared to. He produces at a similar rate to Brayden Schenn at even strength while player far tougher minutes. He produces far less than Patrice Bergeron, but he is given harder minutes and weaker linemates. He also is seven years younger than the decorated Bruin.
The key with Couturier is staying patient. As I will address tomorrow, there are a number of things that Couturier, Dave Hakstol, and Ron Hextall can do this summer and next year to take Couturier to the next level.
In case you missed it, here is a link to Part One.