I was using the site Natural Stat Trick for a recent article and saw that there is a way to look at metrics against individual teams. That led to me pondering which teams were the easiest or hardest to play against, not using records but by looking at the metrics – Corsi For and Goals For.
I looked solely at 5-on-5 stats, no power play, penalty kill, or overtime stats. The 5-on-5 gives the most balanced numbers because it is the situation with the largest sample size. My initial thought was that the teams with the best records were also the hardest to play against using the metrics. What I wanted to find was if there were any departures from that assumption – where a team with a bad record played well against a playoff team or vice versa.
One vs. 29: Measuring One Team Against the League
The first step was to find every team’s base stats for the two categories – Corsi For (CF) and Goals For (GF). Both of these are presented as a percentage and when two teams play each other, the total for each category is 100 percent. The share of Corsi counts and goals that a team has is divided by the total and the answer is converted to a percentage. So for the league over a full season, the average is simply 50 percent for both areas. This is because the opposite of these categories would be Corsi Against and Goals Against and they would equal the remaining 50 percent of the totals.
After finding each team’s base metrics, I found CF and GF versus every team in the league, yielding 29 results for each team. Afterwards, I calculated the difference between a team’s base stats and that team’s stats versus an individual team. Once I found that difference, I determined the average difference for the league versus a team.
Here is an example:
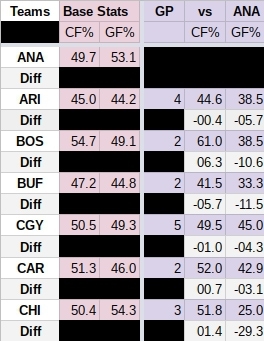
On the left are base stats and on the right are how those teams fared against the Anaheim Ducks. In the cases of the six visible teams, all played worse against the Ducks using GF. Meanwhile, half had a worse CF when playing the Ducks compared to their season average. Take note of the GP column. This stands for Games Played and is important to consider because teams only play cross-conference teams twice each season. When a team only faces another two times, it magnifies any differences that occur. This is a major reason why I found the league’s average versus a team rather than using just two individual teams and how they fared against each other.
Two On-Ice Metrics to Measure Quality of Team
Once I calculated the league’s average against a team, I found which teams gave the league the easiest and hardest matchups for each category.
Corsi Not Always a Representation of Success
Corsi is a nice metric because it factors in all shots attempts. This includes any blocked shots, misses, or ones that hit the goalpost. It is typically used to represent possession as a team has to possess the puck to attempt a shot.
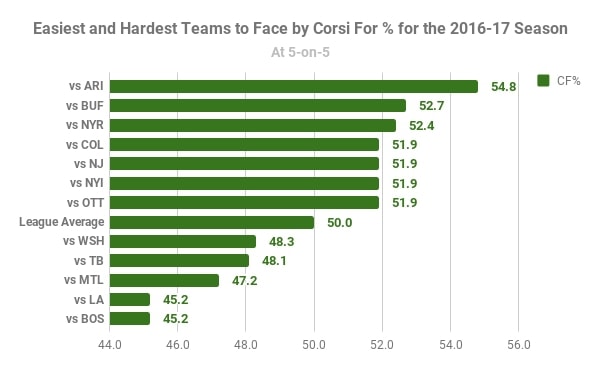
When looking at CF, we can see that of the teams below 50 percent, three were playoff-bound with the Los Angeles Kings and Tampa Bay Lightning being the exceptions. The teams with CF’s below league average indicate that the league played worse than the season average. For example, when facing the Kings, the league had a regression of 4.8 percent in CF. This makes sense as the Kings led the league in CF at 54.99 percent.
In fact, of the five teams who gave opponents the most difficult time using CF, only the Lightning were outside the top five in CF percentage. They ranked seventh. Meanwhile, the Nashville Predators ranked fifth in Corsi percentage and tied for the 10th most difficult matchup for the league.
On the opposite end were the teams that presented the easiest matchups. Just two of these teams made the playoffs, the New York Rangers and Ottawa Senators. All of these teams were in the bottom 10 in the league in Corsi percentage. Unsurprisingly, the Colorado Avalanche, New Jersey Devils, Arizona Coyotes, and Buffalo Sabres also finished in the bottom five in points.
Goals are Still the Best Indicator of Success
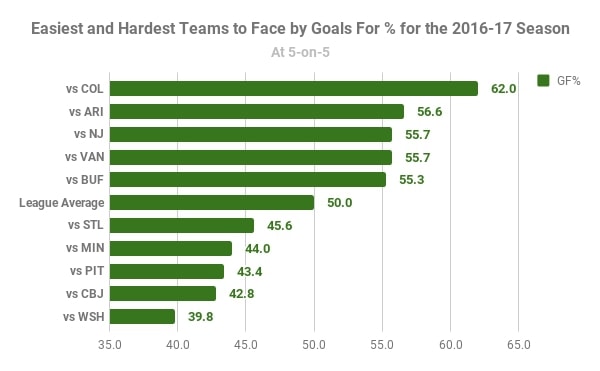
As expected, the five toughest teams using the GF metric were all playoff teams. More than that, four were in the top five in points last season with the St. Louis Blues tying for 10th. These teams were also successful in the playoffs with the Pittsburgh Penguins winning the Stanley Cup and the Blues and Capitals reaching the second round. The Columbus Blue Jackets lost to the Penguins and the Minnesota Wild lost to the Blues, both in round one.
It makes sense that opponents of the Presidents’ Trophy-winning Capitals had the lowest GF percentage with a three percent margin. For the season, they led the league in goal control with 61.38 percent at 5-on-5 while the second best team was at 56 percent. The reason for this wasn’t their elite goalscoring but that they allowed the fewest 5-on-5 goals last season.

The teams that presented the easiest matchups had the five lowest point totals last season. The Avalanche were the worst team in the league with 48 points and also increased opponents’ GF by 12 percent. That was nearly double the second easiest team, the Coyotes, at 6.6 percent. The Coyotes weren’t the second worst team points-wise but did tie for third and just one point behind the 29th place Vancouver Canucks. To me, this says that goals are a strong predictor of success and the teams that control goals the best will be the hardest teams to defeat.
Sometimes the NHL Doesn’t Make Sense
Anytime you look at 30 teams with a season total of 1,230 games outliers are a reality and existed in this data. In this case, they occurred when teams with poor records played well against those that presented the most difficult matchups and vice versa.
The Coyotes were the easiest team to play using Corsi and the second easiest using goals. Yet, when the Calgary Flames played them, the Flames GF dropped 27.9 percent compared to their season average. The Flames were a playoff team last season yet struggled in their five games against the Coyotes.
Similarly, in the four games between the Senators and Bruins last season, the Senators increased their GF by 40 percent. For the season, the Senators controlled 48.9 percent of goals at 5-on-5 but were able to have great success against the Bruins, controlling 88.9 percent of goals and going 4-0-0. Perhaps that should have helped predict their series win in the playoffs against Boston.
Lastly, the Avalanche had the eighth worst CF at 5-on-5 last season and had the fewest points. But, when facing the Blues, a team they played five times, the Avalanche’s CF increased 6.8 percent. On the season, they had a 48.6 percent Corsi but played like the best puck possession team in the league when playing the playoff-bound Blues. Unfortunately for the Avalanche this increase in Corsi didn’t equal success as they went 1-4-0 against them.
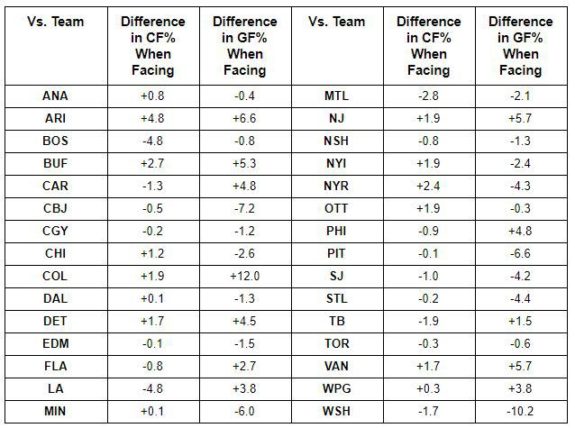
How Each Team Stacked Up Against the League
Thanks for reading and always enjoy reading your comments.
*All stats came from Natural Stat Trick