For the first time since 2004, the World Cup of Hockey is back – and with a brand new look.
The tournament features the standard “Big Six” national teams of Canada, USA, Czech Republic, Russia, Sweden and Finland as well as two All-Star teams: Team Europe and the top players from North America 23 years old or younger.
New teams and lack of competitive international play since the 2014 Olympics make it difficult to gauge who the favorites are heading into the World Cup starting on Saturday.
Although Canada is the presumptive favorite given their recent Gold medal and IIHF world championship — there are still unknowns about the talent level of the two new teams, and how the rest of the big six stack up in this World Cup compared to previous international tournaments.
Thankfully for us, we have data to help solve this problem.
The Hockey Writers coverage of the World Cup of Hockey 2016 is being brought to you by PrimeSport, the official Fan Travel & Hospitality Package Partner of the World Cup of Hockey 2016.
What the Data Says
To try and predict which teams are the best in the World Cup of Hockey, it would be best to use each team’s aggregate PDO and CF% to see how they stack up against one another. As I discussed earlier this summer, both of these advanced statistics do a fairly good job of predicting team performance.
For a quick refresher, let’s take a look at why.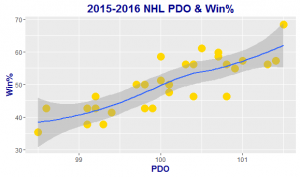
PDO, or a team’s Shot% + Save%, is a very strong indicator of a team’s win percentage – as seen in this plot.
This shouldn’t come as much of a surprise; naturally the teams who score the most often and stop the most shots should win the majority of their games.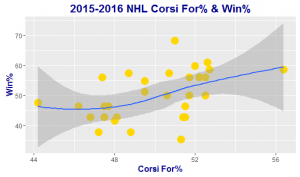
Although CF% doesn’t hold as strong of a relationship with a team’s win percentage as PDO, it is still worth taking into consideration. A team’s CF% shows how many shots a team put towards the net relative to their opponents, and teams with a higher percentage are seen to have had a higher proportion of scoring opportunities.
So how do the World Cup of Hockey teams stack up in PDO and CF%?
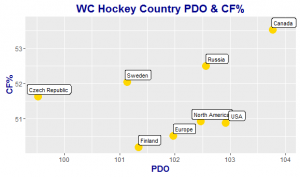
This plot shows the aggregate of each team’s CF% and PDO given their players’ stats in the 2015-2016 NHL season.
Of the 184 players participating in the World Cup, 11 didn’t play in the NHL last season and had to be left out of this calculation. Finland has the most non-NHL players with four skaters and one goalie, but this amount isn’t significant enough to drastically skew their numbers.
All eight of the World Cup teams possess a CF% of over 50 percent, and Czech Republic is the only team with a PDO under 100. 100 is the barometer for evaluating PDO since it will always be the average – this is because there will always be an equal amount of goals for and against across the league.
With each of these team’s PDO and CF% in hand, we can use a regression to predict each team’s expected win%.
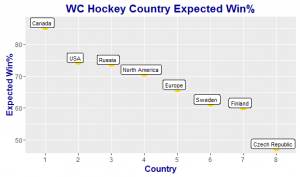
The chart shows each country’s expected win percentage relative to NHL teams. For example, if Team Canada were to play as an NHL team, they would be expected to win over 80 percent of their games.
Canada looks to be the runaway favorite, but USA, Russia, and the North America U-23 team have the best chance of denying them another international championship.
All of the World Cup teams are projected to have finished amongst the top three NHL teams last season, except for Czech Republic. The Czechs enter the tournament with Tomas Hertl as their leading scorer with 21 goals for the Sharks last season, and have an expected win percentage of just 48 percent. This would’ve made them a fringe playoff team in the NHL last season.
Although the numbers say we should expect Canada to come away with another major international title, no data is needed to be certain we are in for two weeks of good hockey starting this weekend.
All data in this article is courtesy of hockey-reference.com and espn.go.com.