It’s been a long season for the Carolina Hurricanes. It looks to be nearly over as the chances of the team making the playoffs are almost non-existent. Technically, they are still in contention, but realistically, it is the longest of shots. A look at some statistics tells the sad story.
Believing What You See
When looking back over what seems destined to be a season that ends in massive disappointment, it’s easy to point at several areas that could have been a lot better for this season’s Hurricanes. For example, the team’s goal differential is abysmal, 188 goals scored versus 218 goals allowed, a differential of -30.
It does not take advanced analytics to discern that allowing more goals than a team scores is not a recipe for success. I wrote about this area that needs improvement for the Hurricanes in A Christmas Wish for the Hurricanes. That was almost three months ago, with the numbers looking bad at that time:
The Hurricanes are ranked 24th in the NHL in goal differential, the difference between goals for and goals against. They are sporting a negative 12 goal differential. That is not good, nor is it the kind of statistic upon which playoff runs are made. Looking at the teams ahead of them in this statistic shows that teams that are getting the puck into the net are also showing up in the playoff race.
A negative-12 has ballooned into a negative-30 in three months. What is really intriguing is that when that article was written, the Philadelphia Flyers and the Hurricanes both had 37 points and were three points out of a wild-card playoff spot. The Flyers went on a tear after beating the Hurricanes in their first matchup this season in early February and are currently in third place in the Metropolitan Division, looking like a solid lock for the playoffs.
Two Teams Diverge
Interestingly enough, the Flyers do not have the best goal differential either, but it is significantly better than that of the Hurricanes. It is currently a negative-2, based on 208 goals scored and 210 goals allowed. What should jump off the page is the disparity between the two teams in the area of goals scored. The Flyers have scored 20 more goals than the Hurricanes, a fact that could easily explain how they went racing to the top of the division while the ‘Canes stood still or went backward.
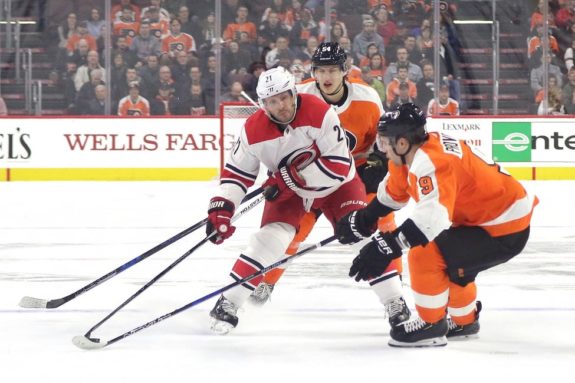
Three weeks after their first matchup, the Hurricanes faced a must-win game with the Flyers, this time in Philadelphia. Saturday night, the Flyers return to Raleigh for game three against the Hurricanes, and the skate is on the other foot. The Flyers are trying to stay in one of the top three playoff spots, while the Hurricanes are about to start calling for tee times.
Advanced statistics, analytics and anything that tries to explain mathematically what we see with our eyes are sometimes difficult to grasp. I will admit that I have not been the biggest student of Corsi, Fenwick or the myriad of other ways of analyzing NHL players’ performance. For the most part, I like to observe and form an opinion. For example, “He should have had that,” when a puck sails by the goaltender. That’s an easy observation and doesn’t require a lot of thought or a calculator.
But, when it comes to the Hurricanes, what you see is exactly what you get. It doesn’t take advanced math to figure out what is wrong. The lack of offensive production has crushed the hopes of the team making the playoffs, something that is easily seen and easily verified by looking at goal differential.
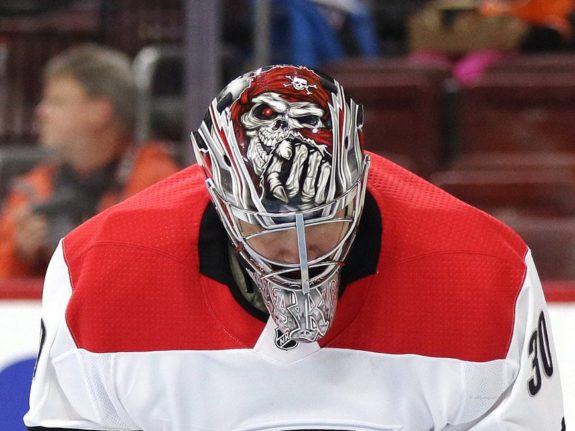
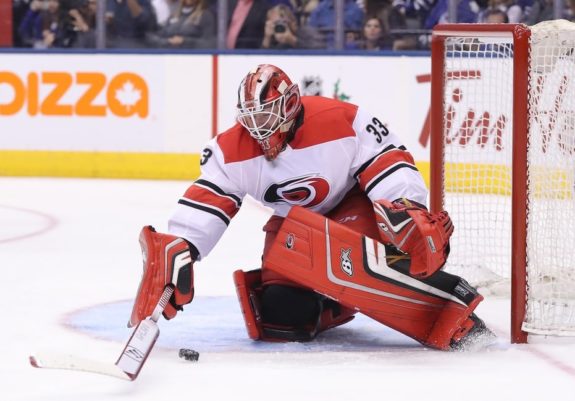
Hurricanes Need Help at Goaltender
There are some analytics that are also helpful in confirming what one has determined by watching. For example, when it comes to goalies, there is a statistic known as GSAA – Goals Saved Above Average. At In Goal Magazine, GSAA is explained like this: “You take the league’s average save percentage and apply it to the amount of shots a particular goalie has faced. You get a number of goals that the average goalie in that league would have surrendered if they faced the same number of shots as the goaltender in question.”
“That number gets compared to the number of goals surrendered by that goaltender, and a plus/minus is created. If a goalie is in the positive, that is how many goals they have saved compared to a league-average goalie. If they are in the negative, then it is safe to assume that they are performing worse than how a league-average goaltender would perform in the same situation.”
Simply stated it is a comparison tool and it can be very revealing. For example, when looking at Scott Darling, the Hurricanes’ starting/backup/who knows goaltender, it is easy to visually assess his play as very weak. A look at his GSAA confirms the eye test. It is minus 13.33. Cam Ward’s GSAA is minus 3.67.
The Hurricanes could stand to have better goalie play. This Tweet screams at the problem, using another advanced analytic called Medium Danger Save Percentage or MD sv%:
https://twitter.com/dabrams2021/status/974243703266119683
Again, most of the time numbers are used to confirm what we have already seen on the ice. With 12 games to play, we’ve seen the play of a team that is definitely not playoff-worthy. The numbers confirm it, especially in goal differential and goaltending.