The 2018-19 season marks the Florida Panthers’ 25th as a franchise. With five playoff appearances in their history, they haven’t been the epitome of success. However, despite lacking team success, there have been many players in franchise history who had great seasons that have stood the test of time.
Some seasons are notorious for individuals setting franchise records, some stand out for great individual performances on an otherwise untalented roster, and still others are notable because they were impressive in a low-scoring era. The following seasons are the best in franchise history and each fit into one of the preceding categories.
Honorable Mention
Jaromir Jagr – 2015-16
Stats: 79 games played (GP), 27 goals (G), 37 assists (A), 66 points (P), 22 even-strength goals (EVG), five power-play goals (PPG)
We get the list started with future Hall-of-Famer Jaromir Jagr’s 2015-16 season. He was only a Panther for two full seasons but had quite an impact with 49 goals and 130 points in 181 regular-season games. His 2015-16 season was his best in Florida when, as a 43-year-old, he led the team in points and even-strength goals.

His 48 games with a point tied Teemu Selanne for the most games with a point by a player in his 40s since the 1987-88 season when the stat was first calculated. Jagr also had 16 games with at least two points in 2015-16. The Panthers won 33 of 48 games when he tallied a point but went 13-15-3 when he was kept off the scoresheet.
He was also instrumental in the team returning to the postseason after a three-year absence, where they were ousted by the New York Islanders in six games. Jagr had no goals and two points in the series.
The 10 Best Seasons
10. Roberto Luongo – 2015-16
Stats: 62 GP, 35-19-6, .922 save percentage (SV%), 2.35 goals-against average (GAA), 4 shutouts, 12.34 goals saved above average (GSAA)
Related: The Future of Panthers’ Luongo
Goaltender Roberto Luongo is the franchise leader in nearly every goaltending category, including games, wins, losses, saves, shots against, and shutouts. He leads the team in those areas despite being a Vancouver Canuck for seven-plus seasons. In his tenure with the Panthers, the team qualified for the postseason once, also the only time they finished better than third in the division.
However, the Panthers’ struggles were not Luongo’s fault, who typically faced more shots than the average goalie and finished with a .500 or better record once during his first stint with the team.
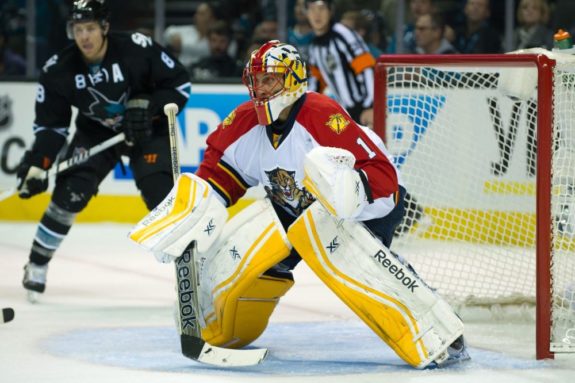
Luongo appears twice on this list, first for his 2015-16 season when, as a 36-year-old, he was top-10 in save percentage, wins, and games played. He had 20 games in which he allowed fewer than two goals, tied for fifth-most in the league.
He was especially successful against in-division foes and won at least 80 percent of his starts against the Tampa Bay Lightning and Montreal Canadiens. The result was besting the Lightning by six points en route to the Panthers winning their division for the second time in franchise history. Luongo finished the season tied for third in goaltender point share, a measurement of a player’s impact on his team’s point total, and finished fourth in Vezina Trophy voting.
9. Vincent Trocheck – 2017-18
Stats: 82 GP, 31 G, 44 A, 75 P, 15 EVG, 13 PPG, 3 shorthanded goals (SHG), 5 game-winning goals (GWG)
It’s difficult to fairly compare seasons from the 1990s, when scoring was elevated, with recent seasons as the league continues to recover from the Dead Puck Era. For example, the league averaged 3.24 goals per game in 1993-94, the Panthers’ inaugural season. Meanwhile, in 2017-18, that average was down to 2.97 per game, which is still higher than the seasons immediately following the most recent lockout in 2012-13.

Still, a comparison has to take place, and that’s why the next two seasons are on the list despite the players’ totals not being as lofty as earlier seasons.
In 2017-18, center Vincent Trocheck led the team with 31 goals and 13 power-play goals in his age-24 season, as he provided great center depth behind Aleksander Barkov. He had 53 games in which he registered at least a point, which led the team and tied for 11th-most in the league.
He had two six-game point streaks while his longest pointless streak over the 82-game season was three games. Trocheck was lethal against Western Conference teams, posting at least four points against the Anaheim Ducks, Edmonton Oilers, and St. Louis Blues in only two games against each.
When he registered at least a point, the Panthers went 31-22-6 and 13-14-2 when he was held off the scoresheet. He was also the driving force on Florida’s otherwise poor 21st-ranked power-play unit, and his team-leading 13 power-play goals represented 27.7 percent of the team’s goals on the man-advantage.
8. Aleksander Barkov – 2017-18
Stats: 7 GP, 27 G, 51 A, 78 P, 17 EVG, 5 PPG, 5 SHG
Aleksander Barkov continued to capture the league’s attention as a strong two-way center in 2017-18, as he led the league in shorthanded goals and finished fourth in Selke Trophy voting. He established a career-high in points and games, and finished one goal behind his career-best while having his lowest shooting percentage since his rookie season.

Additionally, his 53.5-percent success rate in the faceoff dot was sixth-highest among centers who averaged at least 20 minutes per game and was the first time he was above 50 percent in his career.
He had 49 games with a point and led the team with 22 multi-point games. Between games 57 and 64, he had an eight-game point streak and never went more than four games without registering a point. The Panthers’ record in relation to Barkov’s production is one of the widest splits to be found. When he registered a point, the team went 34-9-6, and when he was scoreless, they had an 8-20-2 record. It is clear that the team followed Barkov’s lead.
In his final 20 games, he had six goals and 19 points, and the Panthers went 13-5-2 in that span as they attempted to chase down the final playoff spot in the Eastern Conference. He ended up missing the final two games of the season with an injury and the Panthers finished one point out of the playoffs. His 78 points still led the team by three despite playing in three fewer games than runner-up Trocheck.
7. Roberto Luongo – 2003-04
Stats: 72 GP, 25-34-14, .931 SV%, 2.43 GAA, 7 shutouts, 48.42 GSAA
Luongo’s second season on the list ended with a top-three Vezina finish, and he was named to the second All-Star team. The 2003-04 Panthers were terrible and finished in fourth place, 18 points out of playoff contention. Yet Luongo was magical with a career-high .931 SV% while leading the league in shots against, saves, and goals saved above average.
He allowed one or fewer goals in 20 games, stopped 40-plus shots in five of them, but only won 16 of them, a result of a poor Panthers offense that tied for the fifth-fewest goals scored. Luongo faced at least 40 shots in a league-leading 19 games and had a save percentage of .920 or better in 16 of them. In total, his 44 games with at least a .920 SV%, including 23 against playoff teams, led the league.
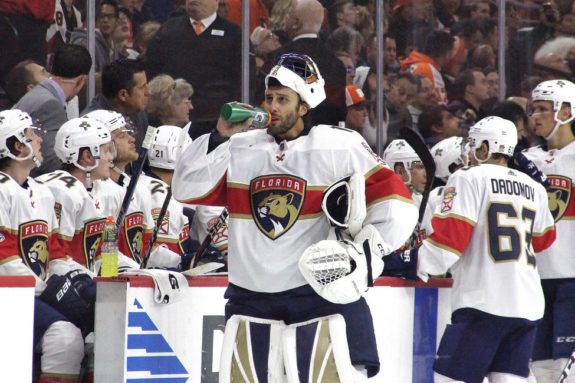
To further convey how magical his season was, his backup, Scott Shields, appeared in 16 games and had an .879 SV%, 3.44 GAA, and a minus-11.19 GSAA. Given the lack of goal support Luongo received, it’s amazing he was even a league-average goaltender, let alone a Vezina finalist.
Additionally, it’s intriguing to consider how many more career wins he would have had he been surrounded by more talent during his tenure in Florida. He finished with a save percentage of at least .915 in eight of his nine full seasons as a Panther, yet has reached the 30-win mark just twice. He reached that win plateau every full season with the Canucks.
6. Olli Jokinen – 2006-07
Stats: 82 GP, 39 G, 52 A, 91 P, 29 EVG, 8 GWG
Olli Jokinen is somewhat of a forgotten player in league history. He finished with 750 points in 1,250 games for his career and had the most success with the Panthers, with whom he accumulated 188 goals and 419 points in 567 games. Both totals are the most in franchise history despite Jokinen playing in only the fourth-most games.
He finished the 2006-07 season with 39 goals and 91 points, but neither were in the top-10 of the league. By comparison, he would have tied for ninth in both categories in 2017-18, an indicator of how much scoring rates have changed over the past decade. Jokinen led the Panthers in goals, assists, and even-strength and game-winning goals, including a 29-point lead over Nathan Horton in second place.
Jokinen finished with a goal in 30 games, six multi-goal games, and three hat tricks. He was dynamic against the Carolina Hurricanes, with six goals and 16 points in eight games, and versus the Lightning, with four goals and 12 points, also in eight games. However, despite his attempts to put the team on his back, the Panthers still missed the playoffs by six points.
5. Ray Whitney – 1997-98
Stats: 68 GP, 32 G, 29 A, 61 P, 20 EVG, 12 PPG, 2 GWG
The Panthers acquired Ray Whitney during the 1997-98 season after he played in nine games with the Oilers. Despite only playing in 68 games with Florida, he led the team in goals, points, and even-strength and power-play goals. He finished with points in 43 of 68 games, including 14 with at least two points.
He started his tenure with the club by registering a point in his first seven games. Before acquiring Whitney, the Panthers won three of their first 14 games. After the trade, they went just 21-36-11, but that doesn’t properly convey his impact. In games when he had a point, the team went 15-21-7 but 6-14-5 when he went pointless.

There was such little production surrounding Whitney that the Panthers wouldn’t have been competitive no matter his production. He had a 12-goal and 13-point lead over Dave Gagner in second place despite playing in 10 fewer games with Florida. Another reason for the team finishing 20 points out of the playoffs was that none of their goaltenders had a save percentage above .899 or a goals-against average below 2.75.
4. Olli Jokinen – 2005-06
Stats: 82 GP, 38 G, 51 A, 89 P, 23 EVG, 14 PPG, 9 GWG
The first of back-to-back seasons of high production, Jokinen’s 38 goals and 89 points in 2005-06 weren’t as high as his totals from 2006-07. However, his value to the 2005-06 Panthers was higher as he led the team by 10 goals and 33 points. He also led the team in, assists, and power play and game-winning goals.
The Panthers still finished fourth in the division but it had nothing to due to with Jokinen’s efforts. When he had a point, the team went 34-9-10, a winning percentage of 64.2, but won just 10.3 percent of games when he wasn’t on the scoresheet.
He had a goal in 28 games and a point in 53 along with 27 multi-point games, which tied for seventh-most in the league. Meanwhile, no other Panther had more than 13 such games. In spite of limited talent around him, Jokinen almost willed the Panthers into the postseason.

Between games 63 and 72, the team went 9-1-0, including 5-1-0 versus eventual playoff teams, and Jokinen had 12 points. From game 73 to season’s end, they had a 4-4-2 record and went 3-2-0 for playoff teams. They scored two or fewer goals in six of their final 10 games and allowed at least four in five.
He still had 11 points during the span but the team couldn’t provide supplemental help. In total, in games against Eastern Conference postseason teams, Jokinen had at least two points versus all eight, including 14 points in eight games against the Lightning and 10 in eight when playing the eventual Stanley Cup champion Hurricanes. His production against Tampa Bay was highest in the league.
3. John Vanbiesbrouck – 1993-94
Stats: 57 GP, 21-25-11, .924 SV%, 2.53 GAA, 1 shutout, 55.62 GSAA
John Vanbiesbrouck’s 1993-94 season is interesting because his stats weren’t as good as Luongo’s listed above. Yet, due to the degree of difficulty, Vanbiesbrouck deserves to be this high. The 1993-94 season was Florida’s first as a franchise and followed an expansion draft in which they selected Vanbiesbrouck from the Canucks.
It’s similar to what Marc-Andre Fleury went through with the Vegas Golden Knights except that the odds were stacked against the Panthers.
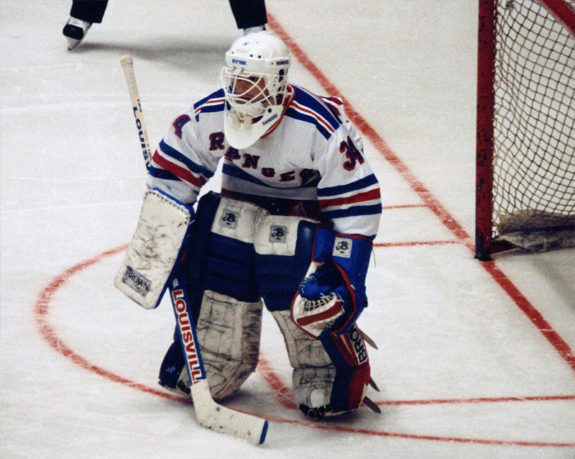
Vanbiesbrouck set career highs in save percentage, shots faced, and saves made, in addition to a personal best and league-leading 55.62 GSAA. He finished the season with a sub-.500 record and only one shutout but earned a place on the second All-Star team and was a finalist for the Vezina and Hart Trophies.
Given that the Panthers’ leading scorer had 60 points, Vanbiesbrouck was the main reason the team finished one win below .500 and 12 points ahead of the other expansion team, the Mighty Ducks of Anaheim. His 15.2 point shares were double the next-highest on Florida’s roster (7.2 by defenseman Gord Murphy).
2. Pavel Bure – 2000-01
Stats: 82 GP, 59 G, 33 A, 92 P, 35 EVG, 8 GWG
The Russian Rocket, Pavel Bure, occupies the top two spots because he still holds the franchise’s single-season records for goals and points. His 152 goals as a Panther remain the third-most in team history despite him only playing 223 games with them. For the 2000-01 season, he won his second of back-to-back Maurice “Rocket” Richard Trophies by leading the league with 59 goals.
He scored a goal in 42 games, second-most to Joe Sakic, tied Jaromir Jagr for the most multi-goal games with 12, and his four hat tricks tied fellow Russian Alexei Kovalev for the league lead. He had a seven-game goal streak between games 70 and 76 with 13 goals in that span, and his longest goalless streak was four games, which he did twice.
Although the Panthers were terrible and only won 22 games, it was not because of Bure. He led the team in goals and points by 45 and 55, respectively, outpacing Viktor Kozlov in both. When Bure scored a goal, the Panthers won 14 of their 22 games, and they had 24 of their 38 losses when he failed to find the twine.
1. Pavel Bure – 1999-00
Stats: 74 GP, 58 G, 36 A, 94 P, 45 EVG, 14 GWG
There’s no other choice for the best season in Panthers history than Bure’s 1999-00 season. He had 58 goals, including 45 at even strength, and 94 points in only 74 games. He led the league in goals, even-strength goals, game-winning goals, shots, goals per game, goals created, and offensive point share.
His average of 0.78 goals per game remains the second-highest rate since the 1998-99 season among players with at least 70 games played. His 41 games with a goal, 12 multi-goal games, and four hat tricks all led the league. In addition to winning the Rocket Richard Trophy, he also finished third in Hart Trophy voting and earned a spot on the second All-Star team.
Not only was Bure dynamic during the regular season in leading the team by 29 goals and 23 points, but he also had talent surrounding him, and the Panthers reached the postseason for the third time in franchise history. In a four-game sweep at the hands of the future Stanley Cup-winning New Jersey Devils, he tallied a goal and four points.

Not only is Bure’s 1999-00 season the best in franchise history in several categories, but by wide margins in some areas. His 45 even-strength goals are 10 more than second-place. His 0.78 goals-per-game average is 0.06 higher than the next best season and his 1.27 points-per-game mark is 0.15 higher. In second place in all three categories? Bure’s 2000-01 season.
His 1999-00 and 2000-01 seasons are the best in franchise history, and by a wide margin. What sets his earlier season apart is that he scored one less goal but had two more points in eight fewer games.
*All stats came from Hockey-Reference and NHL.com