..mainly due to the Long Shot

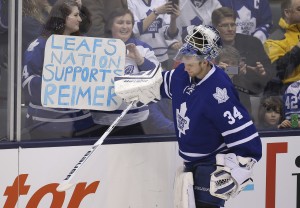
If NHL teams only took shots from less than 30 feet and penalties were never awarded, James Reimer would be the best goaltender on the Toronto Maple Leafs over this past season. Unfortunately for the Winnipeg native, that’s not the case. The bad goal and the penalty kill cost Reimer a lot this season, notably his starting job, his relationship with Leafs management and some fans.
Jonathan Bernier was the better goaltender for the Blue and White this season and he played well enough to justify earning the starting job, there’s no denying that. His .922 save percentage appeared to be leaps and bounds ahead of Reimer’s .911. But when the numbers are broken down further, it’s interesting to see exactly why and how the two goalies differed. Surprising to some, Bernier was outperformed over much of the ice.

Penalty kill save %
Even strength save percentage is probably the fairest assessment of a goaltender’s performance, and one shouldn’t put much stock into goals given up on the PK as a way to judge a goalie.
Why? Well for starters, the Leafs’ penalty kill was horrible this year, as its 78.4 percentage was 28th in the league. Second, shots tend to be more selective on a PK than an even strength chance, as teams will look for an opening and value quality over quantity. Lastly, shorthanded save percentages often have very little correlation to a goalie’s even strength save percentage. (Steve Mason has an .894 save percentage shorthanded, whereas Tuukka Rask sits at .873, 52nd in the league). Bernier sits at .881 shorthanded, so he has the edge over Reimer, who is stuck with an .841 save percentage, both of which are in the league’s lower half (43rd and 79th).
It makes sense, really. How often do you see a penalty kill where the goalie was forced to try to save a puck with a player shooting at a wide open net? Quality over quantity is usually the name of the game on an NHL power play.
So if it’s fair to say penalty kill numbers often have little to do with goaltender skill but rather the quality of shots they face, and it’s tough to really use those numbers in any goalie’s favour. They tend to be all over the map in relation to even strength save percentage. But for argument’s sake, we’ll give Bernier the (slight) edge, though neither goalie really was impressive shorthanded.
Comparing by Even strength save percentage
(all data available via Greg Sinclair at Super Shot Search)
Now we’re talking. Two good goalies on a more even playing field- how did they perform? (Of note- these stats are all from regulation, 5 on 5)
| Shot Type | Bernier | Reimer |
| Scoring Chance | .862 | .862 |
| <10 feet | .843 | .856 |
| 10-20 feet | .872 | .878 |
| 20-30 feet | .885 | .883 |
| Under 30 feet | .869 | .875 |
| 30+ feet | .971 | .953 |
Scoring chances save %
The two were identical at 862. Talk about consistency, but the edge goes to neither. (Scoring chances are calculated from a home plate shaped area in front of the net, extending into both playoff circles).
Shots < 10 feet
Reimer was better.
Shots 10-20 feet
Again, Reimer was better.
Shots 20-30 feet
Bernier is better… slightly. .002 is a one-two goal difference over an 82 game season with identical shot totals, so it’s tough to say Bernier was really much better than Reimer.
Shots <30 feet
Reimer, as a whole.
Shots 30+ feet
Ah, the bad goal. For whatever reason, Reimer struggled with shots over 30 feet at even strength, more so than Bernier. Reimer gave up 27 goals from over 30 feet, whereas Bernier gave up 25, with considerably higher shots (572 to Reimer, 874 to Bernier). For Reimer to have the same save percentage as Bernier with these shots, he would’ve needed to stop 11 more out of the shots he faced. Not any easy task, but it’s definitely doable if Reimer were to perform just slightly better over the course of the season.
Not allowing shot attempts at all from 30+ feet in the first place would be ideal, but that’s impossible to eliminate completely. Sure, a shot at 30 feet is less likely to go in on Reimer than a shot at 20 feet, but a blocked shot will not go in at all. Playing on a team that gave up more shots than any other in the 82-game era couldn’t have helped Reimer, and surely blocking few of those 30 footers would have helped Reimer’s stats, morale, and standing with the Leafs.
It makes sense that a 30 foot shot is easier to block than a 10 foot shot- so it’s the defense’s responsibility to block them better.
And if shots aren’t blocked, they’re likely at least partially screened from that distance. So if you’re getting in the goalies’ view but not stopping the puck, it’s not rocket science you’re doing more harm than good. There’s no one explanation I can offer, but it’s likely a mix of a few bad plays by Reimer mixed with some poor jobs of the defence to clear out defenders in front and block shooting lanes that lead to his poor save percentage from over 30 feet.
I’m also not a goalie coach, but I’m sure there’s something that can be done to improve Reimer’s vision in seeking out the long missiles, which clearly needs some work. Pepper him with 20 screened shots a day in practice until he shows a legitimate improvement, or use some other method to increase this weakness of his.
Does this mean Reimer was better than Bernier this season? Yes and No. Reimer’s inability to stop the long shot and penalty kill struggles severely hindered his shot at success, but it’s quite possible to point to evidence that he actually outplayed Bernier on several areas of the ice. As a whole, Bernier’s season was better and he was deserving of landing the number one job, but really, he wasn’t drastically better than Reimer except on long shots and the penalty kill.
Previous Year by year breakdowns at even strength
To be fair to both goalies, it would make sense to look at more than just one season. So how do Bernier and Reimer compare year by year from each distance and shorthanded? Let’s take a look.
2012-13
| Shot Type | Bernier | Reimer |
| Scoring Chance | .867 | .870 |
| <10 feet | .880 | .838 |
| 10-20 feet | .825 | .847 |
| 20-30 feet | .857 | .911 |
| <30 feet | .860 | .877 |
| 30+ feet | .986 | .953 |
| Penalty Kill | .868 | .911 |
Similar trend, as Reimer outperformed Bernier again scoring chances, and shots less than 30 feet, but for whatever reason Bernier was better on shots <10 feet and over 30 feet. Overall, however, Reimer’s numbers look better, besides the long shot, which again was not stellar. Reimer was much better this year than usual on the penalty kill, which is no surprise because the Leafs were as well, ranking 2nd in the league. Reimer put up .924 overall, whereas Bernier put .909.
2011-12
| Shot Type | Bernier | Reimer |
| Scoring Chance | .794 | .842 |
| <10 feet | .826 | .895 |
| 10-20 feet | .789 | .849 |
| 20-30 feet | .833 | .862 |
| <30 feet | .797 | .856 |
| 30+ feet | .988 | .967 |
| Penalty Kill | .926 | .810 |
Reimer was better at even strength in every category except shots over 30 feet and penalty kill… I’m sensing a trend. However, Reimer’s overall save percentage was .900, while Bernier’s was .913. Yet, Toronto’s PK ranked 28th. LA’s ranked 4th. Reimer again outplayed Bernier almost everywhere, but the same issues persisted. It’s a wonder that the Leafs haven’t really been able to improve Reimer’s troubles with the easier shots, because his issues appear to be longstanding.
2010-11
| Shot Type | Bernier | Reimer |
| Scoring Chance | .876 | .879 |
| <10 feet | .915 | .873 |
| 10-20 feet | .856 | .889 |
| 20-30 feet | .908 | .864 |
| <30 feet | .868 | .881 |
| 30+ feet | .959 | .967 |
| Penalty Kill | .880 | .855 |
Again Bernier was better within 10 feet, so maybe he’s got something to be said for his ability to stop shots in close. And he was also very, very solid between 20-30 feet, although this was not replicated throughout the rest of his career, so it’s a bit of an anomaly. LA’s penalty kill ranked 4th again, whereas Toronto’s was again 28th, which is the likely reason for the save percentage differential. But overall, Reimer was better both less than and greater than 30 feet at even strength. Reimer’s .921 overall save percentage also topped Bernier’s .915. And while Reimer was better at 30+ feet, his save percentage was still troublesome from long range, and Bernier wasn’t all that impressive either. Either way, it’s evident Reimer has not been stellar with longer shots over the course of his career.
So what does this all mean?
Long story short, while Bernier’s initial numbers from this season suggest he was far superior to his fellow crease mate, further analysis proves his increased numbers are a product of nothing more than his better play shorthanded and the issues that Reimer has with longer shots. Correctable mistakes most likely, but the issue remain constant throughout Reimer’s brief career. It’s an enigma why these issues exist, but I’m willing to bet the Leafs poor defensive play will lead to issues such as screening or wide-open scoring chances where Reimer is left out of position.
Reimer’s career numbers were also better before Bernier came to town, but neither goalie ever played a full season as a starter, so it’s tough to compare. However, trends suggest that #34’s been a more effective goalie than #45.
This isn’t a knock on Bernier- he played a great season and was in Vezina conversations for much of the year. But one can only wonder how different things would look had Reimer been able to make a few more ‘easy’ saves here and there, and if both goalies were able to play under a good penalty kill, because evidence suggests the man they call Optimus Reim was superior in many situations, not just this year but over the course of Reimer’s three previous seasons.
In a perfect world, both goalies would be happy with their roles and the competition for more starts would be consistent, but not a cause for any real debate about who the true #1 goalie is. However, that isn’t the case, and it’s assumed by many Reimer has played his last game in a Toronto uniform.
If those rumours hold up to be true, the Leafs may be saying goodbye to the better half of their goaltending tandem.

You dismiss the goalies performance where Bernier is better than Reimer, but in reality isn’t that when you want your goaltender to be the best??? The PP and PK are often the difference in games these days… and a 4% difference is a pretty big gap to simply dismiss…