San Jose Sharks center Joe Thornton has just finished a Hart Trophy worthy season. One statistic that has been used quite a bit to justify his Hart candidacy is the number of consecutive wins for San Jose during which Joe Thornton has scored at least one point. Thornton scored at least one point in each of the Sharks last 33 wins.
I did not use this statistic in support of Thornton in our Facing Off discussion over the Hart Trophy because I really was not sure what to make of it. So I decided to dig a bit deeper. My conclusion is that it isn’t what it seems. A streak is a combination of elements. Some more obvious than others.
Before I go any further, let me define the term ‘streak’ for this particular context. It is the number of consecutive games a team has won where one specific player has at least one point in each of the wins. That definition seems simple enough, but it is more nuanced than it might appear.
I’ll forewarn the readers. I’ve tried to make it easy to read for those without statistical backgrounds. You’ll let me know if I succeeded.
The Challenges of Interpreting a Streak
Statistics that come in the form of streaks can be difficult to interpret. They often represent an atypical distribution coupled with personal excellence. Perhaps the most famous streak in sports history is Joe DiMaggio’s 56 game hitting streak in 1941. His streak is a delicious combination of superb play, human factors and statistical flukiness. Ironically, it is not even clear that DiMaggio was the best hitter in baseball during that streak. I’ve put several interesting details about DiMaggio’s streak in my notes following the article.
http://gty.im/3209454
DiMaggio’s streak is, statistically speaking, unlike Thornton’s streak in several critical ways. DiMaggio’s streak is an individual effort, largely (though not wholly) independent from the team’s performance. Thornton’s streak links his individual performance to team results. Conceptually, the relationship between a hockey player scoring a point and their team result seems inherently murky, especially in a sport where the player is not playing for 2/3 of the game.
If we go to the extremes, we can get some idea of the meaning of a link between individual results and team results. If a player never scores, there is obviously no correlation at all between wins and that player’s points scored in a game. If a player is involved on 100 percent of his team’s goals, the correlation is 100 percent, the player will have scored in every win. Thornton is statistically linked to 1/3 of his team’s scores. Chicago’s Patrick Kane is linked to 45 percent of Chicago’s scores.

Embedded in the structure of this statistic is another quirk. It carries a strong ‘predictive bias’ towards the outcome of a game. By requiring the designated player to score a point in the game, it means his team has a scored at least one goal. This leads to a corresponding requirement: the other team must score a minimum of two goals to win. That relationship is important, as a substantial portion of NHL games have a team score one goal or less. This is a cousin, statistically speaking, of oft-used statements like “when this team scores first, it has an 82 percent chance of winning …”.
Also embedded in the statistic are games that do not count. By definition, not a single loss is part of the streak. Thornton’s streak is 33 games long, but it is a subset of the 61 games the Sharks have played since their November 22, 2015 game. That day, the Sharks played their 21st game of the season. They beat Columbus 5-3 while Thornton was held without a point. It marked the last game during the regular season the Sharks would win without a Thornton point.
There were 28 losses in the streak. The Sharks were 0-12-1 when Thornton did not score. There were 15 games where Thornton scored, but the team lost; ten regulation losses and five in either overtime or the shootout. Over the 61 games, the Sharks were 33-22-6.
Predictive Bias
As mentioned before, the predictive bias (the requirement that the other team score at least two goals to stop a streak, which is derived from the definition of the stat) plays a role. In 18 of the 33 wins (55%) during the streak, the Sharks opponents scored one goal or less. In 27 of the 33 wins (82%), they scored two goals or less. Given the bias that the Sharks were known to have scored at least one goal, this shows the Sharks had a better chance at winning these games compared to arbitrarily chosen games.

In order to examine this predictive bias, I took an empirical approach, I looked at what other guys did. I took three groups of players and applied similar criteria. I started with a group of Thornton and his peers. These are high scoring players who played all (or very close) to 82 games for teams which had a good season. The players in this peer group are Patrick Kane, Sidney Crosby, Jaime Benn and Joe Thornton.
In the second group, I selected a teammate of each player in the first group. I selected modest scoring players who played almost every game. These players had between 21 and 32 points for the season. They are Justin Braun, Johnny Oduya, Matt Cullen and Niklas Hjalmarsson. I looked at the team’s record in games these mid-level players had a point.
The third group consisted of three high scoring players from weaker teams, Blake Wheeler of Winnipeg, Taylor Hall of Edmonton and Erik Karlsson of Ottawa.
I looked at the team’s record when the given player scores a point and when they did not. I added up the team points and divided by the number of games played to get ‘team points per game’. We should see the bias show up in these numbers. It should show higher team points per game when the specified player has a player point in the game. A phrase used to describe statistics with a large inherent bias is “paint the bulls-eye around the arrow”. If you shoot the arrow first and then decide where it lands is the target, you get great results.
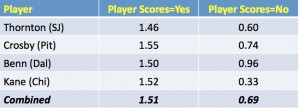
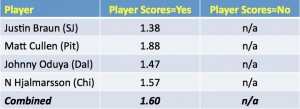
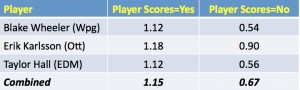
First off, we get a strong proof of the predictive bias. In games where a designated player scores a point, the team is far more likely to have success. In each case, the team’s record was far better for the games the designated player scored a point. For Thornton and his peer group, the team results were more than twice as good: 1.51 team points per game versus 0.69. Multiplying these numbers by 82 represents a full NHL season, making the numbers easier to grasp. The ‘designated player has a point’ and the ‘designated player does not have a point’ shows the expected bias. It is very large. It is the difference between a team getting 124 team points for the season versus a team getting 57 team points, a difference of 67 points. This season, the top NHL team had 120 team points, the worst had 69, a difference of 51. In other words, this bias has a larger difference than the one between first and worst NHL teams! If a player from the mid-tier group scores, it projects even higher, to 131 team points for a season. This is not surprising, as secondary scoring in a game is often an indicator of team success in that specific game. Lastly, we note that top players on weaker teams also show a similar bias, perhaps to a slightly lesser degree.
Does this statistic definition paint a bulls-eye around the arrow? Yes it does.
A second observation shows Thornton is essentially average among his peer group. Over the course of the entire season, the relationship between Thornton’s scoring a point in a given game and the team’s success in those games is similar to his peers. When the Thornton does not score a point, the team results are also similar to his peers.
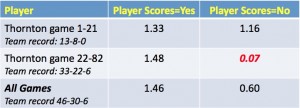
Next, I divided the season into two parts. Those games before the streak (games 1-21) and those during the streak (games 22-82). The team points per game are radically different. One substantially better than average, the other substantially worse, as shown in the chart below. The figure in red, 0.07 team points per game, merits closer examination because it is so different from the rest of the data.
Digging Deeper
For the season, the Sharks were 7-17-1 in the 25 games Thornton failed to score. Through game 21, San Jose was 7-5 in games Thornton did not score. From games 22-82, the Sharks were 0-12-1 in games Thornton didn’t score. Is this about Thornton, the team or some strange statistical combination?
It is helpful to put the 25 games where Thornton did not score into two groups. The first group is the 7-5 group (the team record compiled during games 1-21 when Thornton did not score). The second group is the 0-12-1 group (the team record in games where Thornton did not score during the streak, games 22-82).
I compared these two groups of games. The goal distributions are below.


For the twelve games in the 7-5 group (prior to the streak), the Sharks were outscored by just one goal, 24-23. A 7-5 record is not surprising given the almost identical goal totals.
In the 0-12-1 group, opponents outscored the Sharks 42-17. Comparing the two groups, the Sharks scoring went from 1.9 ‘goals for per game’ down to 1.3. Defensively, it went from 2.0 ‘goals against per game’ to 3.2. As a ratio, it went from essentially even in the first group to 2.5:1 against San Jose in the second group.
Over the course of the season, the Sharks did what they were supposed to do (statistically speaking) when Thornton failed to put up a point. They lost more often than they won while being outscored by their opponents. The season-long result is very much in-line with Thornton’s peer group. But we’ve been able to distinguish two distinct groups inside this result, one well above expectations, the other well below.
http://gty.im/505588140
I decided to run an additional test on these two groups. What would happen if Thornton had scored one point in each game, giving the Sharks one more goal per game? There is not exact answer. The games that would have different results are:
a. games decided by one goal
b. games decided by two goals where the final goal was an empty net goal
Among the games in the 0-12-1 group, eight were either decided by one goal or were one goal games prior to an empty net goal in the final minute.
Had Thornton scored a point in all these 13 games instead of being shutout in these games, the Sharks would have recorded an additional 10-12 team points. Using the ’12 additional team points’ scenario, the Sharks would have collected 13 team points in 13 games, 1.0 team points per game. Recall from earlier, when Thornton scores, the Sharks average 1.5 team points per game. In the earlier charts, I looked at 11 players. Every time a player scored a point in a game, their team, on average, recorded more than 1.1 team points. Even for Edmonton, Ottawa and Winnipeg.
This result takes us in perhaps an unexpected direction. It highlights the ineffectiveness of the rest of the Sharks team. Even if Thornton did score a point in each of these 13 games game, the team would have substantially underachieved. Conversely, had he scored a point in each of the games in the 7-5 group, the Sharks would have added 4-5 team points in that time. Adding four team points would result in the Sharks earning 18 team points in 12 games, or 1.50 team points per game for that group, exactly meeting expectations.
One more note about the streak. During the first 21 games of the season, the Sharks were 13-8, on pace for a 102 team points season. During the streak, the Sharks were 33-22-6, a pace that projects to a 94 team point season. While the Sharks record was similar in both segments of the season, it was actually slightly better before the streak.
Probability Theory Weighs In
Joe Thornton scored 82 points in 82 games, an average of exactly one point per game. Had Thornton actually scored exactly one point in every game, the streak would equal the number of team wins. But as we all know, player points do not distribute evenly. I’ll divide a game up into six 10 minute segments, giving Thornton a 1 in 6 chance of scoring in any given segment. Using basic probability theory, Thornton has a 66 percent chance of scoring a point in a game. Over the course of a season, Thornton scored a goal in 69 percent of the Sharks games, suggesting his scoring distribution was normal (in a statistical sense).
In games without a point from the elite players on top teams (Kane, Thornton, Crosby, Benn), their teams won 29.2 percent of their games. This suggests that, on average, a streak should last 3-4 games. Thornton’s streak had 13 games where Thornton was scoreless, therefore 13 opportunities for the streak to be interrupted. Using the 29.2 percent figure, the odds of the streak going uninterrupted 13 times is 1.1 percent.
Thornton’s 33 game streak took place over 61 games. Patrick Kane had a 25-game streak this season that took place over 41 games. There were only five games out of the 41 where Kane failed to score in that streak. Meaning there were five opportunities to break the streak. On the sixth opportunity, the streak ended. The the odds of the streak going uninterrupted five times is 18 percent.
The Streak
Thornton’s streak seems to combine three things. First, there is the oddity of the statistic itself. There is a bias embedded into the statistic’s definition that helps make streaks more likely.

Second is the statistical distribution issue. The average “streak” for a player such as Thornton should run about four games. 33 games is very far out on the tail of the curve. Other comparable players did not have a streak as long as Thornton’s, even though, as a group, they were similar over the course of the season. Human factors played a role. One example came when a Sharks opponent (Arizona) left their net empty while down by two goals in the last minute of a game while also on the penalty kill. Most coaches throw in the towel in that scenario. But because one didn’t, the streak continued. Probability says a streak like Thornton’s is possible, just very unlikely.
Third, there is a very clear difference between the Sharks team play in the games Thornton failed to score in the pre-streak part of the season (the 7-5 group) and the streak part of the season (the 0-12-1 group). In the pre-streak group, the ratio of goals scored by the Sharks relative to their opponents was almost exactly 1:1. In the streak part, the ratio favored the Sharks opponents by a whopping 2.5:1. During the 0-12-1 part, the Sharks had two or fewer goals in 11 of the 13 games and never more than three. On average, the Sharks were outscored by two goals per game. Thornton didn’t score, but the rest of the team was not good either, scoring at a rate of 1.3 goals per game, less than half the season average of 2.8. To make matters worse, they were not great defensively either, giving up 25 percent more goals than their season average. Even had Thornton been getting points, the results would have been well below average.
After all this analysis (and plenty more on the cutting room floor), the best I can say is the streak is more oddity than meaningful. From the start, this struck me as an odd statistic. The more digging I did, the odder it seemed. This statistic is primarily used to illustrate the greatness of the player. Yes, the player is great, just not for this reason.
To the extent the streak is meaningful, it is seems to say less about Thornton and more about problems with the rest of the team. In that light, one could reframe the streak as follows: The Sharks are so lacking in depth that in games where Thornton doesn’t get a point, the Sharks have lost 13 in a row and been outscored 42-17 in the process. Even had Thornton scored a point in all of those games, the Sharks would still have been badly outscored. This problem has gone on since November. Taking an honest look at an odd statistic has yielded some unexpected results. Of one thing I am certain. It is a lot more complicated and nuanced than those who use the statistic seem to understand.
Zeke’s Notes
Streaks and statistical oddities are nothing new. Joe DiMaggio’s hitting streak is among the most analyzed records in sports history. If a hitting streak were pure probability, it is easy to set out parameters for a simple analysis. DiMaggio’s batting average over the streak was .408. Assume the player gets four at-bats per game (a streak-friendly assumption) and a 40.8% chance of a base hit each at bat. This results in an 87% of getting a hit in a given game. A 20 game hit streak results in a 7% chance; a 56 game hit streak, less than 0.1%. DiMaggio’s hit streak, statistically, was a major outlier.
No one has ever said DiMaggio was anything less than superb in the streak. He hit 15 home runs and struck out just five times. Ironically, even during the streak, he may not have been the best hitter in the game. Boston’s Ted Williams hit .406 for the season, winning the batting title, 31 points ahead of DiMaggio. Williams also won the home run title. On the day DiMaggio’s streak ended, Williams led DiMaggio in the race for the batting tile by 20 points.
Human factors played a role. In game 36 against St. Louis, the Cardinals manager ordered his pitcher, Bob Muncrief, to walk DiMaggio. It would be DiMaggio’s last at bat of the game. Muncrief refused and DiMaggio got his hit. Quantifying human factors is far more challenging than probabilities. Under an increasingly intense spotlight, the mentality of the pitchers, umpires, opponents and DiMaggio himself all played a role. DiMaggio reportedly confirmed a rumor that he would be paid a large sum of money if the streak reached 57 games, as a tie-in to the product Heinz 57.
The hitting streak turns 75 this year and it really has not been challenged. One can find a wealth of analyses, many conflicting, on the factors which allowed the streak to happen.
Free Newsletter
Get San Jose Sharks coverage delivered to your inbox
In-depth analysis, breaking news, and insider takes - free.
Subscribe Free →