Stealthy Success
If you ask someone who they think is the best defenseman in the world they’ll probably respond with names like Drew Doughty, P.K. Subban or Erik Karlsson. These are undoubtedly some of the best blueliners in the game. However, there is one player who is so underrated that he sits among the league’s best skaters without anyone noticing.
His name is Marc-Edouard Vlasic.
San Jose Sharks fans know him as the team’s top defenseman and often consider him to be one of the most underappreciated players in hockey. He has been the Sharks’ anchor on defense for the past few years.
Although he doesn’t put up much point-wise, Vlasic makes a living suffocating his opponents and thrives in a possession game. This is what makes him such a threat: he is able to sway a contest in his favor every time he is on the ice. It doesn’t matter how tough the competition is, the 28-year-old can get the puck and make things happen with it night in and night out.
But how do his underlying and mainstream numbers stack up against the recognized elite? Some graphs from War On Ice will help show us.
Graphical Evidence
Fellow colleague James Tanner composed an article in the offseason naming the top-10 defensemen in the NHL. His picks were (10) Anton Stralman, (9) Nick Leddy, (8) Mark Giordano, (7) Duncan Keith, (6) Jake Muzzin, (5) Victor Hedman, (4) P.K. Subban, (3) Drew Doughty, (2) Oliver Ekman-Larsson, (1) Erik Karlsson. I encourage you to read his piece to see the logic in his choices.
Using his selections as a reference, I created a number of graphs on War On Ice that compared these 10 skaters to Vlasic. Statistics analyzed include possession, goals, scoring chances, and penalties. The results are below.
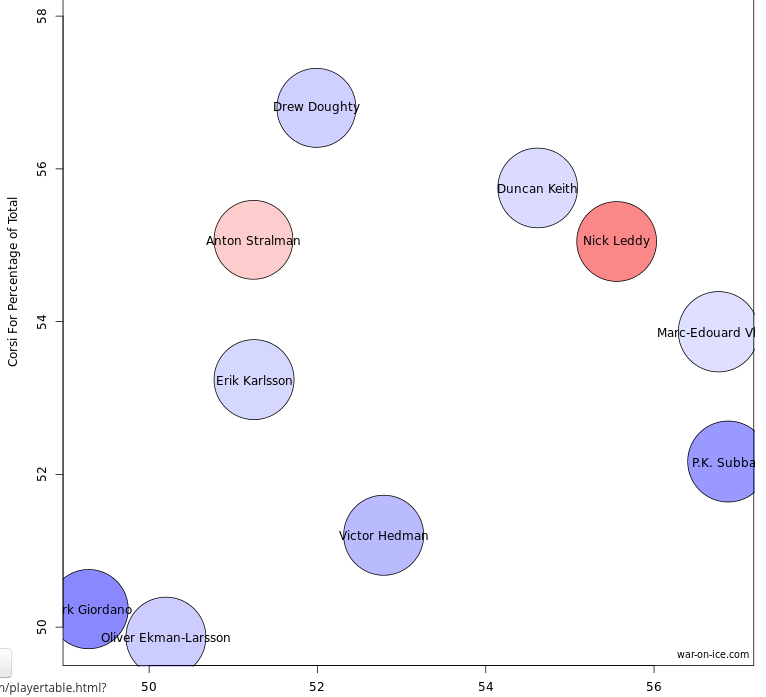
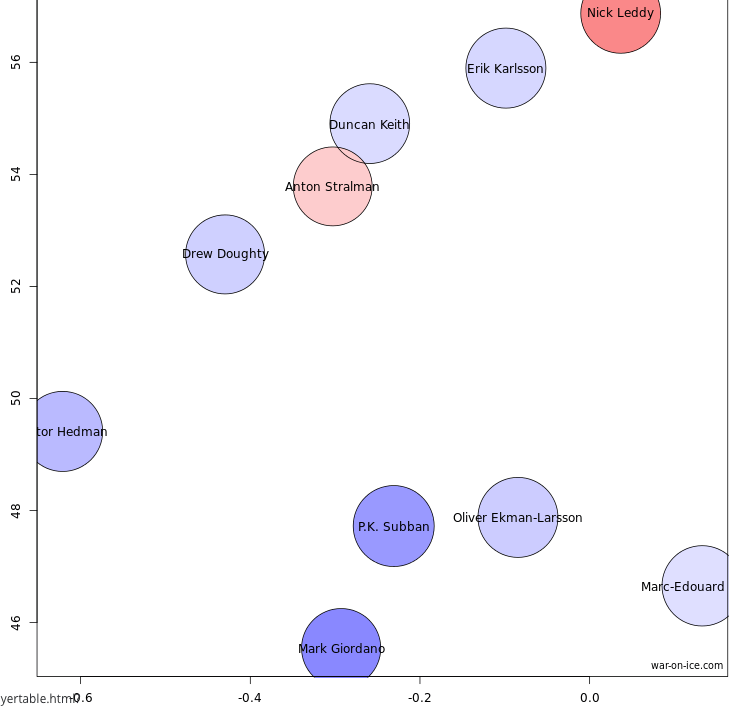
Graph One: Goals-For % vs. Corsi-For %
How to Read the Graph
This graph plots players according to their corsi-for and goals-for percentages. The higher up someone is, the better their corsi-for percentage; the farther to the right someone is, the better their goals-for percentage. A solid skater in both categories will appear in the top-right corner of the graph.
The size of a player’s dot shows their PDO, while the color of the dot indicates their competition’s corsi-for percentage. Basically, a redder dot means lighter competition while a bluer dot means tougher competition.
Not Shown On Graph
Jake Muzzin, who is located above Anton Stralman and has a white dot (meaning neutral competition).
Where Vlasic Stands
The Sharks defenseman is in the middle-of-the-road among these 10 elite skaters in terms of corsi-for, but is the second best when it comes to his goals-for percentage. When he is on the ice, San Jose controls roughly 57 percent of the goals scored. The only player better than him in that marker is Subban.
Vlasic is also one of the top three players on this graph when you average out both metrics. He has a similar mean to both Keith and Leddy, though Leddy has a significantly lighter competition compared everyone else on the graph.
It appears No. 44 is able to gain possession of the puck and help his team score more than most of NHL’s best defensemen.
Graph Two: Scoring Chances

How to Read the Graph
On this graph, we can see how many scoring chances and high-danger scoring chances a team has with a certain player on the ice. Regular scoring chances are on the Y-axis while high-danger scoring chances are on the X-axis. The most effective player will again be on the top-right of the graph.
Not Shown On Graph
Oliver Ekman-Larsson, who sits in the bottom-left corner.
Where Vlasic Stands
Vlasic is the definitive leader in this analysis as he tops all elite defensemen in both scoring chances and high-danger scoring chances. It’s not even close. Even the two people nearest to him play against much lighter competition than he does.
The French-Canadian not only dominates the possession and scoring percentage game, he creates chances as well. Even when the Sharks aren’t scoring, they are spending quality time in the offensive zone whenever their top defenseman is skating on the ice. He controls the play even more than his corsi indicates.
Graph Three: Points per 60

How to Read the Graph
Now it’s time to take a look at each player’s points per 60, divided up by assists per 60 (Y-axis) and goals per 60 (X-axis). These measurements estimate how many goals/assists a player will score in 60 minutes of ice time.
Playmakers are higher up on the plot while goal-scorers are more to the right. A well-balanced skater would be placed on the top-right of the graph.
Not Shown On Graph
Victor Hedman, located above Subban.
Where Vlasic Stands
If Vlasic has a weakness, this is it, and it’s probably why he’s never won a Norris Trophy before. Despite his ability to control the play and his tendency to be on the ice for a large number of scoring chances, he doesn’t put up as many points as his competition. Pickles averages less than 0.8 points for every hour of ice time he gets.
Vlasic ranks second worst in this set with only Anton Stralman having a lower average. However, this should not be weighed too strongly in this assessment. The former-Olympian is a puck-moving, stay-at-home defenseman that specializes in defensive play. Point scoring is not his forte by any means, and it was never supposed to be.
This isn’t the best area of his game, but it should not keep him out of the NHL’s elite.
Graph Four: Penalty Differential
How to Read the Graph
The fourth and final graph shows each player’s penalty differential—the amount of penalties they take vs. how many penalties they draw—and compares it to where they start their shifts. Disciplined players that draw penalties are lower on the graph, and those who start more shifts in the defensive zone are to the right. Contrary to the other plots, the bottom-right is where these men want to be.
Not Shown On Graph
Jake Muzzin, who is above Keith.
Where Vlasic Stands
For the second time in this analysis, Vlasic is the top defenseman in a category. He starts more of his shifts in the defensive zone than any other player on the chart, yet he has the second best penalty differential.
This is impressive since most penalties are committed in the defensive zone. So either Vlasic is very good at drawing penalties when the other team is on the attack, or he is able to take the play into San Jose’s offensive zone and force his adversaries to make an infraction. Either way, he’s doing something right.
Conclusion
Vlasic is no-doubt a solid defenseman, but these graphs show that he should be considered one of the best in the game. He is fantastic defensively and excels in penalty differential, corsi, goals-for and scoring chances despite starting more shifts in his own zone than anyone else. That takes skill.
What is sad is how heavily points are considered in Norris voting. Because of this, known defensive liability Brent Burns is more likely to win the award for best defenseman than Vlasic. A great blueliner stops goals and dictates play; scoring is just a bonus.
Vlasic is slowly gaining recognition around the league ever since he was partnered with Doughty on Team Canada during the 2014 Olympics. He even received some Norris votes two years ago. But he is still heavily underrated considering how skilled he really his. Will his time ever come?
Free Newsletter
Get San Jose Sharks coverage delivered to your inbox
In-depth analysis, breaking news, and insider takes - free.
Subscribe Free →