Advanced statistics have been lauded for their potential for having predictive value. Much as baseball’s shift towards a reliance on on-base percentage – as teams that are full of players that get on base more tend to score more runs and win more games – hockey may be in the midst towards player valuations being based upon puck possession. After all, teams made up of players that possess the puck and put it towards the other team’s net probably score more than other teams, and would win more games because of that.

Corsi Close is one metric that has been commonly used to measure puck possession. Here we take a look at the metric and its effectiveness in translating to a team’s points.
THE THEORY
Corsi is a measure of puck possession. It is a tabulation of all shots on goal, blocked shots and missed shots – effectively it’s a measurement of all shots AT the opposition net, regardless of if they hit the net or not. Corsi can be expressed in a raw form for and/or against, or as a percentage, or as a plus/minus aggregation. Teams with higher Corsi are thought to be the better teams in hockey – such as Los Angeles or Chicago – while teams with bad Corsi are thought to be sub-par – such as Florida, Buffalo or Calgary. There are of course some exceptions.
When teams are up by a significant margin, they tend to take their “foot off the gas,” in the sense that they roll four lines more evenly rather than rely on their skill players (and risk them getting injured in a game that’s out of hand) the way they would if a game was close. Similarly, when a team is down by a few goals, they tend to press harder and try to make something happen to make the game closer. These adjustments are known as “score effects.” Because of these score effects, a Corsi number for all situations may not capture what players or teams are the best in terms of puck possession.
As a result, Corsi Close has become utilized more commonly as a measure. As the name suggests, this takes into account Corsi only in situations where the score is “close” – tied or with a one-goal lead by either team.
THE RESULTS
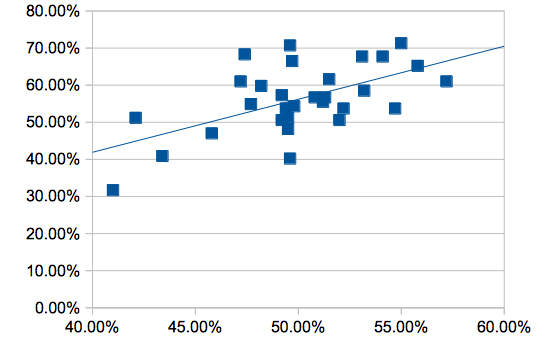
One main comparison for Corsi Close percentage (the percentage of pucks at the net for each team when the score is close) is points percentage, the percentage of available points a team earns. The theory goes that there would be a positive relationship between puck possession (measured via Corsi Close) and points percentage – given the logic behind possession stats – but that since other factors definitely play into how games are won and lost, it wouldn’t be a perfectly linear relationship.
As it turns out, there is a linear relationship, but other factors definitely have an impact. The R-squared (the coefficient of determination) for this relationship is 33.8%, indicating approximately 33.8% of the variation in points percentage can be explained by the variation in Corsi Close percentage.
 THE OUTLIERS
As evidenced by the graph, many of the teams fall fairly close to the line – indicating that Corsi Close percentage does a fairly good job of estimating their points percentage over the season. However, there are eight primary outliers here that merit special attention: four cases where teams over-achieved what their points percentage was predicted to be, and four where the teams under-achieved.
THE OVERACHIEVERS: Anaheim, Colorado, Montreal and Pittsburgh
These four clubs performed better than the Corsi Close analysis would have predicted.
- Colorado: 15.8% more points (26 points) than predicted; The Avalanche had the NHL’s second-best save percentage and the NHL’s second-best shooting percentage as a team. In every sense, they exceeded expectations by “riding the percentages,” led by Semyon Varlamov’s .933 even-strength save percentage.
- Anaheim: 15.0% more points (25 points) than predicted; The Ducks weren’t terribly exceptional in-net, but as a team they had the best shooting percentage of any team in the NHL.
- Pittsburgh: 10.7% more points (18 points) than predicted; Weirdly, the Penguins weren’t exceptional in either of the traditionally-used percentage stats (shooting or save percentage).
- Montreal: 8.8% more points (14 points) than predicted; The Habs rode strong goaltending to a stronger-than-expected finish, in the form of the NHL’s third-best save percentage. Carey Price was second among regular NHL goalies in even-strength save percentage (with a .934 mark) and was a big difference-maker for Montreal.
THE UNDERACHIEVERS: Buffalo, Florida, New Jersey and Vancouver
These four clubs performed worse than the Corsi Close analysis would have predicted.
- Florida: 15.5% fewer points (25 points) than predicted; The Panthers had league-worse goaltending, with the worst team save percentage in the NHL. It probably wouldn’t shock you to learn that Florida used five different goalies in 2013-14 given their effectiveness.
- Buffalo: 11.7% fewer points (19 points) than predicted; The Sabres just couldn’t bury their shots, as they had the worst team shooting percentage in the NHL.
- New Jersey: 9.3% fewer points (15 points) than predicted; the Devils didn’t have bottom-five performances in either team save or team shooting percentage, but they were fourth-worst in the league in PDO (which adds save and shooting percentage together to approximate a team’s “luck”).
- Vancouver: 8.5% fewer points (14 points) than predicted; There was nothing exceptionally poor statistically for the Canucks within the traditional percentage stats.
Free Newsletter
Get Advanced Stats coverage delivered to your inbox
In-depth analysis, breaking news, and insider takes - free.
Subscribe Free →