Hockey fans far and wide collectively let out a sigh of relief this morning. Finally, hockey season is here.
With the 2016-17 season set to commence on Wednesday night, the debate can officially begin: who’s the best team in the NHL?
That’s one of the many questions on the minds of hockey fans after a summer jam-packed with blockbuster trades and free-agent signings.
Amongst the notable moves, this offseason included the swaps of P.K. Subban and Shea Weber – as well as Adam Larsson and Taylor Hall, David Backes signing with Boston and Pavel Datsyuk leaving for the KHL, to name a few.
The slew of summer transactions makes it increasingly difficult to assess how teams stack up against one another heading into this week’s opening slate. How will players mesh with their new teams? Which players will take a step forward, and who will regress?
Let’s take a look at who the numbers think are the best teams heading into opening night.
What the Data Says
Rather than attempt to predict the Stanley Cup winner as often is a trend across hockey media outlets, I will present preseason power rankings based on all the NHL teams’ current rosters.
The justification for rankings over predictions is there are too many variables to account for during the season to foresee nine months into the future. Trades, injuries, new player adaptation, rookies and many other factors come into play throughout the year that no statistic can accurately predict.
To see how teams stack up against one another, the best variables to use are each team’s PDO and Corsi For %. As I discussed in my off-season recap , these two advanced statistics are fairly accurate in predicting future performance.
As a quick refresher, let’s see why.
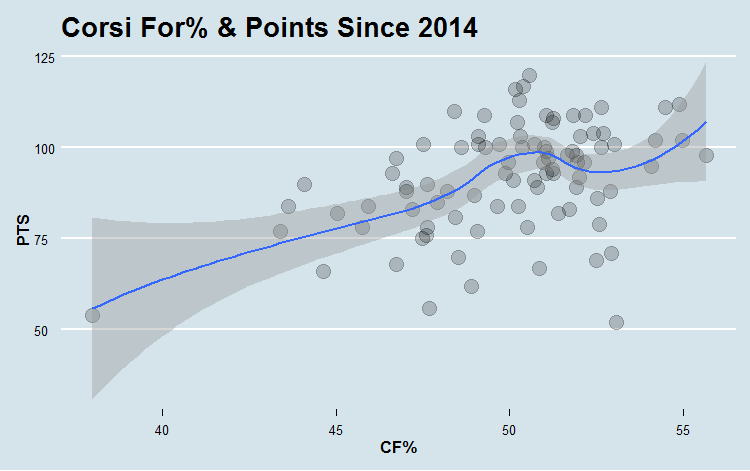
This first plot shows the correlation between a team’s CF% and their win percentage for the past three seasons. A team’s Corsi is an aggregate of their total shots that either were on goal, missed the net or were blocked – so a team’s CF% is a ratio of how many shots a team has compared to the amount they allow.
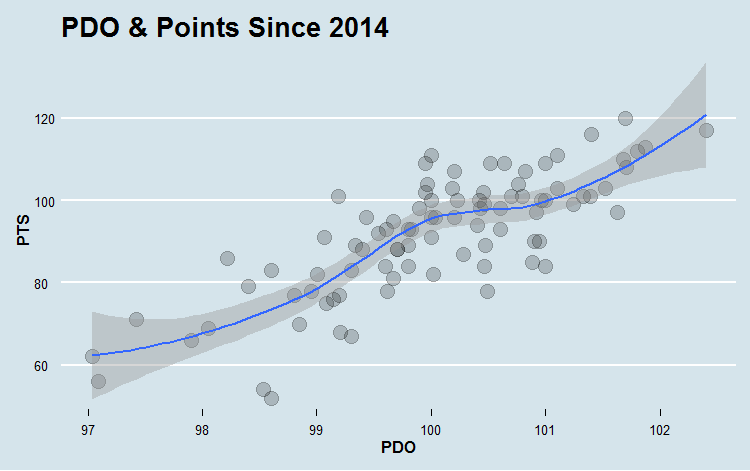
A team’s PDO is an even stronger predictor of performance, as shown by the second plot. The PDO is simply a team’s shot percentage plus their save percentage. The average will always be 100 since the amount of goals for will always equal the amount allowed across the league.
To evaluate how teams stack up against one another, a simple linear regression was used to determine how a team’s PDO and CF% affect their points for the season. The data used to calculate this equation dates back to the 2014-15 season.
Similar to my World Cup predictions, to determine each NHL team’s CF% and PDO, I aggregated each team’s current roster with player statistics from the 2015-16 season.
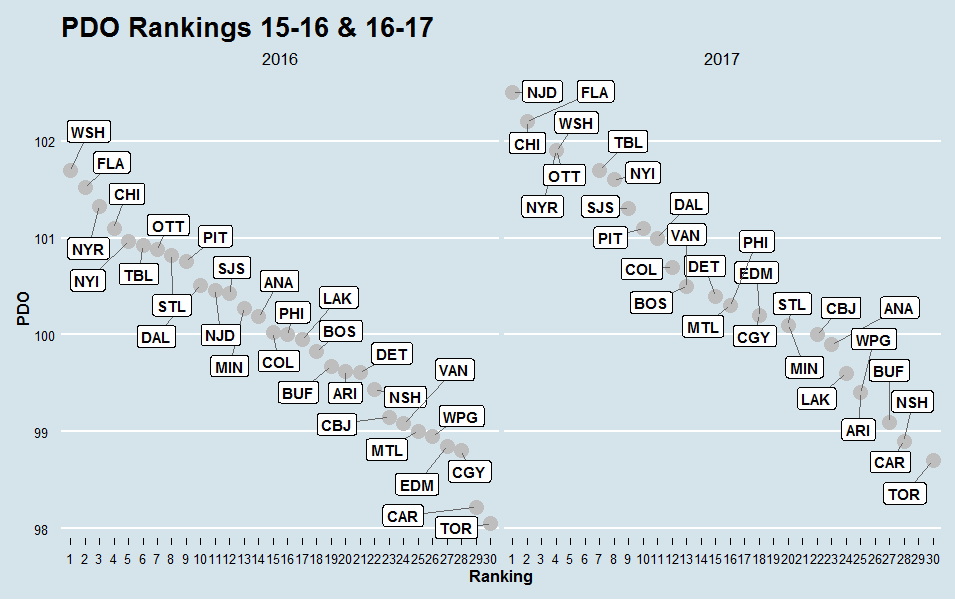
Here’s a look at how teams’ PDO stacks up entering this season, compared to where they finished last year.
Now a similar comparison of team’s CF% from last year to this year.
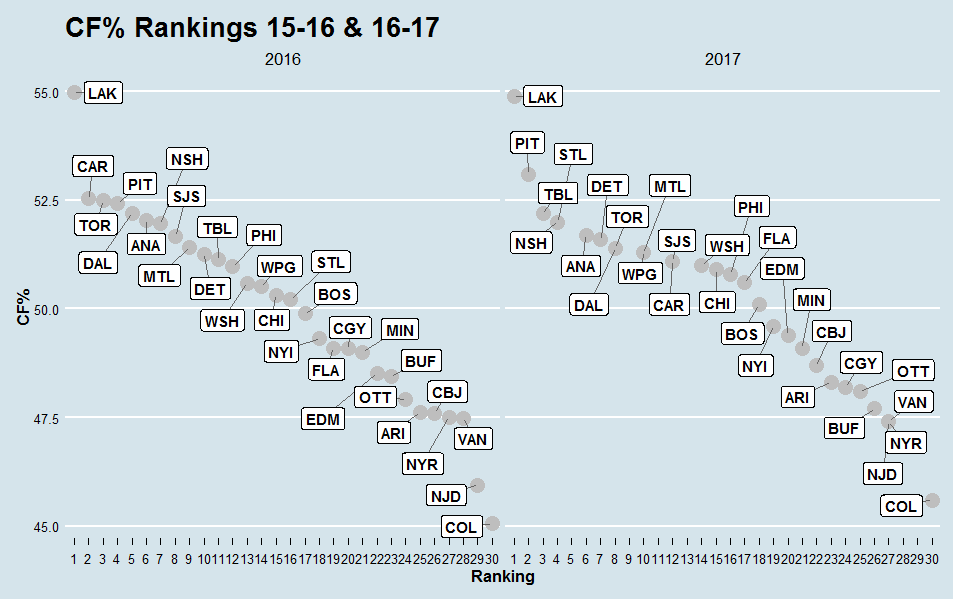
So who’s the best team entering the 2016-17 season? That would be the Chicago Blackhawks.
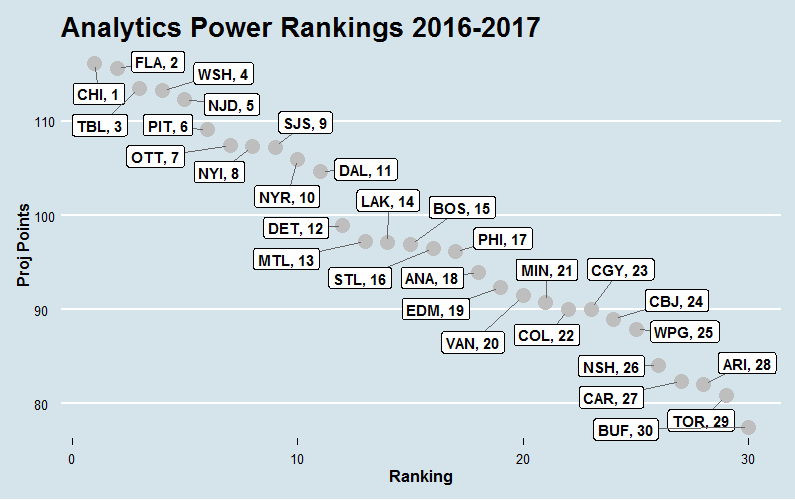
There are several interesting cases worth taking note of right away. The most surprising team in the rankings is surely the New Jersey Devils, who come in at No. 5. Despite finishing 2015-16 20th in the league in points, the Devils tout the highest preseason PDO at 102.5.
A couple of noteworthy drop-offs in the rankings are the Dallas Stars, who are ranked 11th, and the Blues ranked 16th. These drops shouldn’t come as much of a surprise despite both teams finishing in the top three in points last season. The Stars and Blues both lost numerous players during the offseason, and look to be likely candidates to regress this season.
Although Toronto comes in ranked 29th, there is hope for Leafs fans. These rankings are based on 2015-16 statistics and don’t account for rookie sensation Auston Matthews, who should provide a boost in production this season.
Analytics vs Vegas
How do these rankings compare to Vegas odds? Take a look at who Vegas thinks has the best chance of raising the Cup come next June.
- Stanley Cup 2017 Winner (according to Bovada)
- Chicago Blackhawks (11.7% chance)
- Pittsburgh Penguins (9.1 % chance)
- Washington Capitals (9.1% chance)
- Tampa Bay Lightning (9.1% chance)
- Dallas Stars (7.7% chance)
Vegas gives the Florida Panthers, who come in at No. 2 in these rankings, a 5.8% chance of winning the Cup. The Senators and Devils both appear in the top ten, but Vegas gives each a 2% chance to win it all respectively.
Advanced statistics help us paint a picture beyond what our eyes see, but they don’t come without their shortfalls. These rankings can be seen as a useful barometer of evaluating the NHL’s teams, but don’t tell the entire story of what to expect this season.
We’ll have to wait until Wednesday night to see what the 2016-17 season has in store.
—
All statistics and information in this article are courtesy of hockey-reference.com, ABC Sports, and Sports Bovada.
Free Newsletter
Get Advanced Stats coverage delivered to your inbox
In-depth analysis, breaking news, and insider takes - free.
Subscribe Free →