We’re officially out of the ice age.
Hockey analytics took another step forward in the 2015-2016 season as the revolution continues to sweep across the sport. Teams continued to expand or start their own analytics departments, and the Arizona Coyotes named stat whiz John Chayka their general manager at just 26 years old – giving a sign as to where the future of the game is headed.
Terms such as Corsi, Fenwick, zone starts, and PDO have become regular lexicon when discussing and evaluating players and teams. Coaches, broadcasters, analysts, and fans continue to battle over the use of these developing advanced statistics, and which play the greatest role in player and team performance.
The few statistics listed above aren’t an exhaustive list of ‘advanced metrics’, but the main ones focused on in this new analytics era. Let’s take a look at how some of these statistics impacted the 2015-2016 season.
Corsi
The most commonly referenced advanced statistic is a player’s Corsi, which is:
Corsi = Shots on Goal + Blocked Shots + Shots off Goal
The goal of Corsi is to gauge which players are creating the most scoring opportunities. Furthermore, it is also used to observe which players are on the ice when their team controls the puck most often. This is done by measuring a player’s Corsi For % (CF%).
Corsi For % = Corsi For / (Corsi For + Corsi Against)
The idea is fairly intuitive; if a player’s team is putting more pucks towards the net than the other team while on the ice, then it’s expected the player’s team is controlling the puck more often.
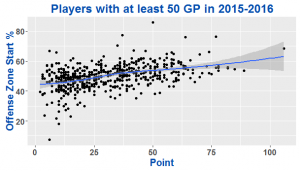
Did Corsi do a good job in showing which players were the most productive?
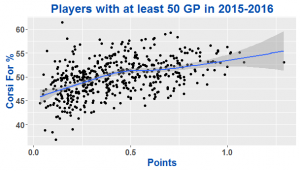
The scatterplot above shows players’ points per game and the CF% for skaters who played in at least 50 games this past season. What this plot shows is a fairly noticeable correlation between a player’s production and their CF%.
An interesting trend also existed amongst the top of the CF% leaders for the 2015-2016 season – an overwhelming amount of Los Angeles Kings skaters.
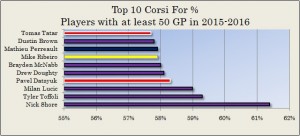
Two of the top three skaters in CF% for 2015-2016 were frequent linemates Milan Lucic and Tyler Toffoli, who combined for an impressive 51 goals, 62 assists, and 113 points. Brayden McNabb and Drew Doughty were also amongst the league’s best defensemen combinations, helping produce 38 goals and only 30 goals allowed while on the ice together.
CF% can also be used to evaluate team performance. How did the statistic look for teams in 2015-2016?
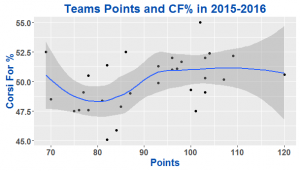
There was also a noteworthy relationship between a team’s points and their Corsi For % for the 2015-2016 season. This shouldn’t come as a surprise – teams putting more shots towards the net than the other team should score more goals and win more games. However, what is interesting are the teams at the top of the CF% leader board:
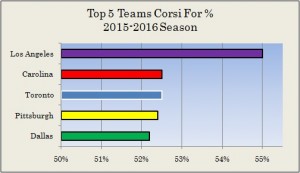
The Kings, Stars, and Penguins shouldn’t astonish anyone as CF% leaders. However, Carolina and Toronto shockingly finished 2nd and 3rd. This may come as a shock to many considering both teams finished near the bottom of the standings and missed the playoffs.
Zone Starts
Another metric often looked at to evaluate player production is what percentage of shifts start with a faceoff in the offensive zone, or their offensive zone percentage (OZS%).
Offensive Zone Start % = Offensive Zone Face-offs / (Offensive Zone Face-offs+ Defensive Zone Face-offs)
Simply put, a player who is given more opportunities to start a shift in the offensive zone should be producing more.
For the 2015-2016 season, this looked to be the case as shown by this plot. There are plenty of reasons to explain this relationship, with the best example being at the top of the offensive zone start % leader board.
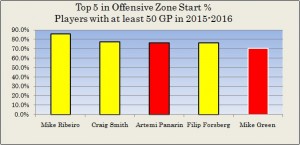
Three of the top five skaters in OZS% who played fifty games or more this past season were Nashville Predators, and were often linemates. When Forsberg, Smith, and Ribeiro were on the ice together they combined for 35 goals for and just 18 allowed. This disproportionate ratio of goals for among this trio should be expected considering each of them had more than 75% of their shifts start in the offensive zone.
PDO
The preferred advanced metric in the hockey analytics community is the PDO. PDO is not an acronym – it is instead simply a team’s shooting percentage plus their save percentage.
PDO = (Shooting % + Save %) * 100
To illustrate how this number is calculated, let’s use example team X. If team X has a shooting percentage (goals scored / shots on goal) of 7%, and a save percentage of 92% (shots saved / shots on goal allowed) then their PDO will be 99 ((7% + 92%) * 100). The league average for PDO will always be 100, since there will always be an equal amount of goals for and against across the league.
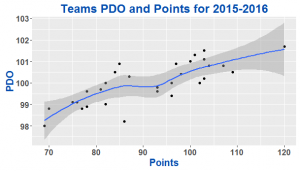
This plot shows the strongest correlation of the three statistics presented. Clearly, teams who have the highest PDO throughout the season had the most success. Looking at the top five teams in PDO for the season shows the same as well.
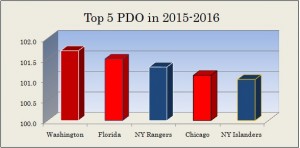
The top five all were playoff teams, and all accumulated over one hundred points on the season. The only team in the top ten for PDO for 2015-2016 that didn’t make the playoffs were the Ottawa Senators, finishing 7th in PDO but 5th in the Atlantic Division.
Conclusions
Should these advanced statistics and others always be taken at face value? Certainly not. If you’ve ever taken a statistics class you’ll surely be familiar with the phrase: “correlation doesn’t mean causation.”
Players with higher CF% looked to be more productive based on the amount of points they accumulated this past season. However, there are other factors that come into play such as linemates, scoring opportunities, offensive zone starts, etc.
Teams with a high CF% also were amongst the leaders in points this past season, including the Stanley Cup champion Pittsburgh Penguins. The Penguins finished 3rd in CF%, although they came behind Carolina and Toronto – who finished the regular season with a modest 86 and 69 points respectively. These two teams were putting more pucks on net than their opponents, but clearly weren’t capitalizing on enough opportunities.
All of these advanced metrics help us gain more insight into players and teams, but are merely pieces of the evaluation process. These metrics are important but don’t always outweigh the simple assessment techniques of a player’s goal and assist totals – or the good old-fashioned eye test.
—
All statistics in this article are courtesy of stats.hockeyanalysis.com, hockey-reference.com, and leftwinglock.com.
Free Newsletter
Get Advanced Stats coverage delivered to your inbox
In-depth analysis, breaking news, and insider takes - free.
Subscribe Free →