Two weeks ago, I began looking into whether or not there has ever been research on how many goals equals a win in the NHL. I’m a fan of baseball and know that plenty of work has been done to determine the value of a run in MLB. I didn’t find any reported findings for the NHL but what I did find was an article written by Bryan Grosnick of Beyond the Box Score.
In it, he calculated expected winning percentages (xWP) for all 30 MLB clubs and how that number compared to a team’s actual winning percentage (aWP). He reached his findings by weighing how many runs a team scored against the number allowed in a formula called the Pythagorean Expectation (PE). From there, he could work through each team and determine how much value an individual run has and thus, how many runs equal a win.
I feel like there is a good bit of comparison between baseball and hockey in that each goal or run is worth exactly one. As a result, it became relatively easy to find the xWP of an NHL team and compare it against the team’s aWP. To find a team’s xWP, I had to apply Pythagorean Expectation. Similar to the Pythagorean Theorem taught in math, the PE works based on this formula:
![]() For hockey, the PE becomes this formula in which “GF” is Goals For and “GA” is Goals Against:
For hockey, the PE becomes this formula in which “GF” is Goals For and “GA” is Goals Against:![]() The exponent “x” is known as the Pythagenpat Exponent and changes per season, reflecting goal scoring rates for that year. That exponent is determined by using this:
The exponent “x” is known as the Pythagenpat Exponent and changes per season, reflecting goal scoring rates for that year. That exponent is determined by using this:![]() The exponent “.458” is used because it has been found to be the optimal rate in the NHL post-WWII and reflects goal trends throughout league history. The result of using this formula is calculating a team’s xWP. We can then use this finding to determine which teams over and under-performed based on expectations. Afterwards, these numbers can be further applied to determine how many goals equal a win for each team. But more on that later.
The exponent “.458” is used because it has been found to be the optimal rate in the NHL post-WWII and reflects goal trends throughout league history. The result of using this formula is calculating a team’s xWP. We can then use this finding to determine which teams over and under-performed based on expectations. Afterwards, these numbers can be further applied to determine how many goals equal a win for each team. But more on that later.
Example of Applying the Formula
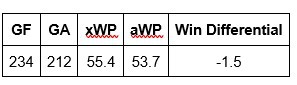
The 2016-17 Boston Bruins scored 234 goals and allowed 212. We plug those numbers into the formula:![]() The exponent “2.19” was determined after taking the number of goals scored per game (5.53) to the power of .458. The result is that the Bruins had an xWP of 55.4. The Bruins won 44 games last season, giving them an aWP of 53.7. In measuring a team’s aWP, I only use wins, not factoring in overtime losses.
The exponent “2.19” was determined after taking the number of goals scored per game (5.53) to the power of .458. The result is that the Bruins had an xWP of 55.4. The Bruins won 44 games last season, giving them an aWP of 53.7. In measuring a team’s aWP, I only use wins, not factoring in overtime losses.
This means that the Bruins underperformed by 1.4 percent compared to their xWP. Considering that one game during a regular season is equivalent to 1.2 percent, the Bruins won one fewer game than they should have.
2016-17 Season Findings
Over-Performing Teams
Of the 30 teams, 13 teams outperformed their xWP by at least a half game last season. Eight of these were playoff teams including the Stanley Cup-winning Pittsburgh Penguins.
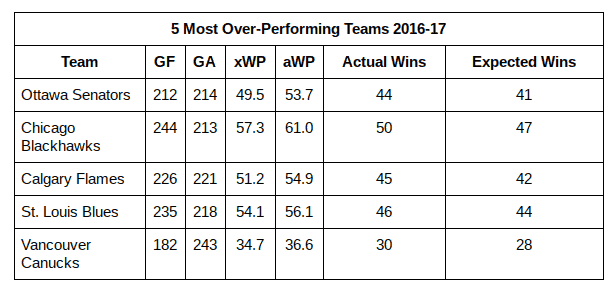
What I learned was that the Senators reaching the Conference Finals was surprising. They had a negative goal differential and had the second lowest Corsi For (CF%) of all playoff teams at 48.6. I also learned that the Blackhawks being swept in the first round shouldn’t have been a surprise. Although they had a good goal differential (plus-31), their aWP was comparable to a team with a plus-48 differential.
Vancouver is interesting because they were a bad team last season and finished with the second-fewest points in the league. However, based on their goal differential (minus-61), they actually had the lowest xWP in the league.
Under-Performing Teams
There were 13 teams that underperformed last season. Seven of these teams qualified for the playoffs, including the Western Conference champion Nashville Predators and the President Trophy-winning Washington Capitals.
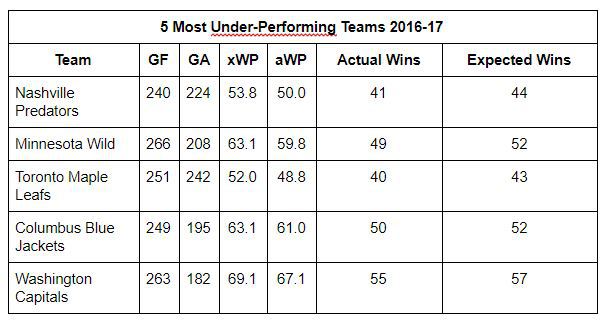
The Predators marched to the Cup Final as the 16th seed but their xWP indicates they were a better team than their record. A reason for this was their 51.5 CF% at 5-on-5, fifth highest in the league. I learned that the Wild should have won the Central Division with a 55.8 percent of goal control at 5-on-5. I also learned that the Maple Leafs were, in fact, a good team but under-performed because they lost 15 games in overtime or shootout. The Capitals underperforming last season despite winning 55 games proves just how good of a regular season team they were even if they were ousted early in the playoffs.
2017-18 Season Findings
When applying the PE to the 2017-18 season, I had to alter the formula to take into account this season’s scoring rate. For this season, there have been 5.92 goals scored per game. This results in an exponent value of 2.26. When applying the formula, I used the goals for and goals against totals for each team through 41 games, midseason in the NHL. I did that to establish a level “playing field” for all 31 franchises. I only considered a team to be over or under-performing if there was a difference of at least one win between xWP and aWP.
Over-Performing Teams
Through 41 games, there were 10 teams who had over-performed their xWP. Of those teams, four are currently in a playoff position.
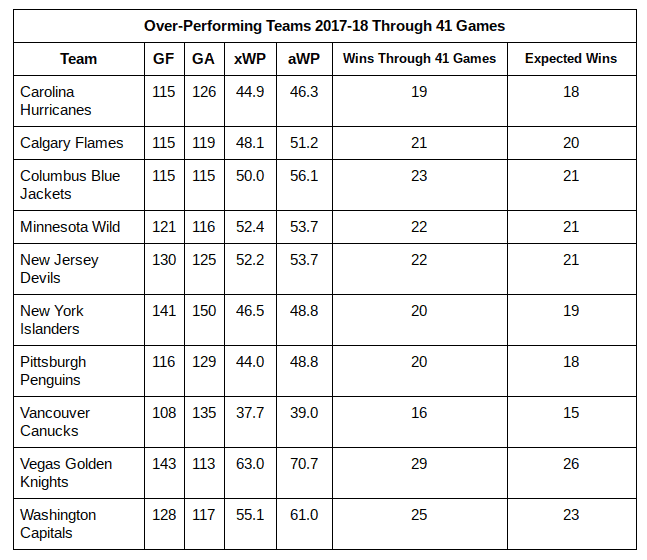
The average xWP of the 10 teams was 49.4 while the average aWP was 52.9 for a difference of 3.5 percent. The average team was two wins better than expected. The Golden Knights, Blue Jackets, Penguins, and Capitals were the most over-performing teams through 41 games.
What I learned is that Vegas’ 12-4-2 record in one-goal games not including shootouts propels their over-performance. These types of games are unpredictable and that level of success in them is unsustainable. That doesn’t mean they are bad, however, and are above 50 percent in all 5-on-5 metrics. Columbus playing above expectation was indicative of future play as they now have a negative goal differential and would have had a plus-13 goal differential after 41 games if their play had met their aWP of 56.1. The Penguins’ issues are that their five losses of at least four goals inflate their negative goal differential. They are also last in the league in 5-on-5 save and shooting percentages.
I’m not certain what is behind Washington’s over-performance through 41 games. Through 48 games, they are in first place in the division, have the league’s best shooting percentage, and have strong 5-on-5 numbers.
Under-Performing Teams
At the midway point of the season, there were 12 teams under-performing compared to their xWP. Five of these are currently in the playoffs.

For the 12 teams, the average xWP was 48.8 while the average aWP was 45.1 for a difference of 3.7 percent. The average team had slightly less than two fewer wins than expected. The Blackhawks, Bruins, Flyers, and Jets were four of the most under-performing teams of the season.
What I learned is that Chicago has continued to have a positive goal differential despite being a sub-.500 team in the wins column. At 5-on-5, they are very good, with all metrics above 50 percent but a struggling powerplay continues to hurt them. The Bruins are a great possession team with a 53.1 CF% but seven wins of at least four goals has inflated their goal differential. The Jets have had a positive goal differential throughout the season but barely have a positive Corsi, meaning their 5-on-5 play is not equivalent to their goal totals.
The Flyers are interesting because their play has improved greatly since the 41 game mark. They now have a positive goal differential and are only 2.4 percent below their current xWP compared to the 4.9 percent difference there was at midseason.
Remaining Teams
After 41 games, there were nine teams that were meeting but not exceeding their xWP. Six of the teams are currently in a playoff position.
I found the Edmonton Oilers to be the most interesting team matching its xWP. Through 41 games, they had a minus-16 goal differential with an xWP of 42.8 and an aWP of 43.9. Currently, with 47 games played, they have a minus-18 differential and are controlling 46.8 percent of goals. At 5-on-5, however, where they have a top-five Corsi, they are controlling 48.9 percent of goals. This goes a long way in conveying how bad the Oilers have been on special teams with a bottom five penalty kill and power play.
The Wrap-Up
After researching the Pythagorean Expectation and applying it to the NHL, I believe that it is an additional way of projecting a team’s performance over the course of a season. I believe that using goal differential as a way to project a team’s results are consistent and have high value. Recognizing when a team over or underperformed expectations in the regular season can go a long way in projecting that team’s performance in the postseason or the following season.
From here, I plan on taking the Pythagorean Expectation and further utilizing it. My goal is to use the findings from researching this article to determine how many goals equals a win in the NHL. By calculating that value for each team, it can be a factor when predicting a player’s impact on a team at the trade deadline or in free agency. Stay tuned.
*All stats came from Hockey-Reference and Natural Stat Trick
Free Newsletter
Get Advanced Stats coverage delivered to your inbox
In-depth analysis, breaking news, and insider takes - free.
Subscribe Free →