- Methodology
- Red Wings Regions
- First Round
- Dominion: (1) Alberta vs. (8) Saskatchewan
- Dominion: (4) Ontario vs. (5) British Columbia
- Dominion: (2) Quebec vs. (7) Manitoba
- Dominion: (3) United Kingdom vs. (6) Eastern Canada
- World: (1) Western Europe vs. (8) Scandinavia
- World: (4) Eastern Europe vs. (5) Czech Republic
- World: (2) Sweden vs. (7) Michigan
- World: (3) USA vs. (6) Russia
- Second Round
- Dominion: (4) Ontario vs. (8) Saskatchewan
- Dominion: (6) Eastern Canada vs. (7) Manitoba
- World: (5) Czech Republic vs. (8) Scandinavia
- World: (6) Russia vs. (7) Michigan
- Third Round
- Dominion: (4) Ontario vs. (6) Eastern Canada
- World: (5) Czech Republic vs. (6) Russia
- Red Wings World Championship: Ontario vs. Russia
- Final Word
Over the last few weeks, I’ve been putting together my projections for 2022 Winter Olympic rosters – if the NHL allows its players to participate in the tournament. Sometime during that process—possibly while adding Filip Zadina and Filip Hronek to Czech Republic’s team—I wondered, which region has produced the best Detroit Red Wings players?
Is it Sweden? Could it be Russia with the Russian Five? Or maybe a Canadian province supplied Detroit’s best?
It’s an interesting question that I didn’t have the answer to. So I figured it out.
Using Sean McIndoe’s roster-building creativity and Dom Luszczyszyn’s playoff simulations as inspiration, I put together teams from 16 regions around the world to find which produced the best Red Wings of all-time.
Before getting to the 16 teams and which triumphed over the rest, let me explain my process.
Methodology
In order to determine which region was best, I pitted them against one another. Consider this your playoffs for the spring.
I chose three forwards and two defensemen for each region. Then I objectively determined their best season as a Red Wing and grabbed their goals per game rate from that particular campaign to use as their scoring probability. For example, Henrik Zetterberg’s best season in Detroit resulted in a 0.573 goals per game rate, so I used that number as his scoring probability.

Next, I split the teams into two divisions and ran them through a playoff, with one game per round. For each game, I used a random number generator (between 0 and 1) to determine if each player scored.1 If the number was less than their scoring probability, they scored. If it was greater, they did not score. Using Zetterberg as the example again, if the random number generator produced 0.111, then he scored in that matchup.
Finally, I tallied up goals for both teams. The region with the highest total won.2
With that out of the way, let’s move onto the regions competing for world domination.
Red Wings Regions
The 16 teams were split into two divisions: Dominion and World. Here’s how the regions were divided up, with a random number assigned to determine their playoff seed.
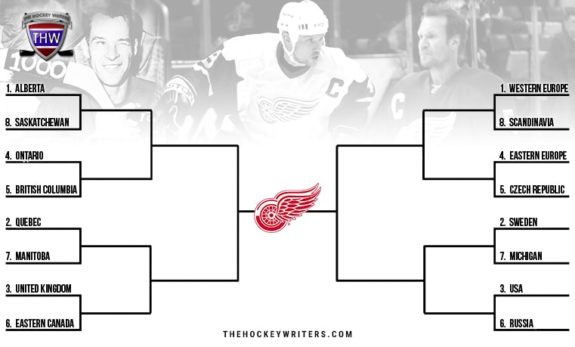
As you probably noticed, four of the teams are composed of multiple regions. Unfortunately, I ran into instances where a region did not have the requisite three forwards and two defensemen, so I had to be diplomatic and expand borders:
- Eastern Canada: Newfoundland, Prince Edward Island & New Brunswick
- Western Europe: France, Switzerland, Austria & Germany
- Eastern Europe: Slovakia & Belarus
- Scandinavia: Finland, Denmark & Norway
Now, let’s get to the playoffs and determine our winner.
First Round
Heading into the first round, Ontario, Alberta, and Sweden were clear favorites to advance. But did they?
Dominion: (1) Alberta vs. (8) Saskatchewan
| Alberta | Probability | Rand | Goal? | Goal? | Rand | Probability | Saskatchewan |
| Norm Ullman | 0.600 | 0.376 | Y | Y | 0.132 | 0.700 | Gordie Howe |
| John Ogrodnick | 0.696 | 0.759 | N | Y | 0.185 | 0.493 | Sid Abel |
| Herbie Lewis | 0.455 | 0.196 | Y | Y | 0.287 | 0.323 | Metro Prystai |
| Mike Green | 0.194 | 0.523 | N | N | 0.202 | 0.169 | Darren Veitch |
| Bill Gadsby | 0.100 | 0.573 | N | N | 0.089 | 0.089 | Brad McCrimmon |
Saskatchewan wins 3-2.
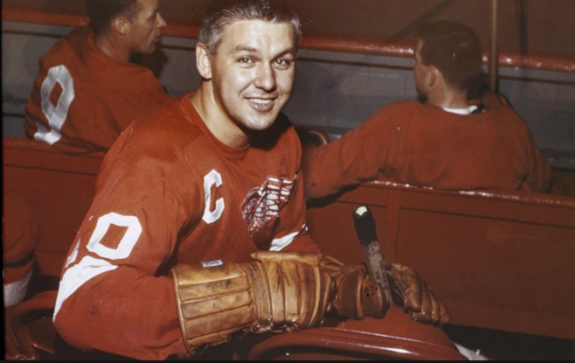
Unsurprisingly, Gordie Howe came through in the clutch to seal the victory for his team. Saskatchewan also received contributions from Sid Abel and Metro Prystai as they downed Alberta in the opening game of the tournament.
Dominion: (4) Ontario vs. (5) British Columbia
| Ontario | Probability | Rand | Goal? | Goal? | Rand | Probability | British Columbia |
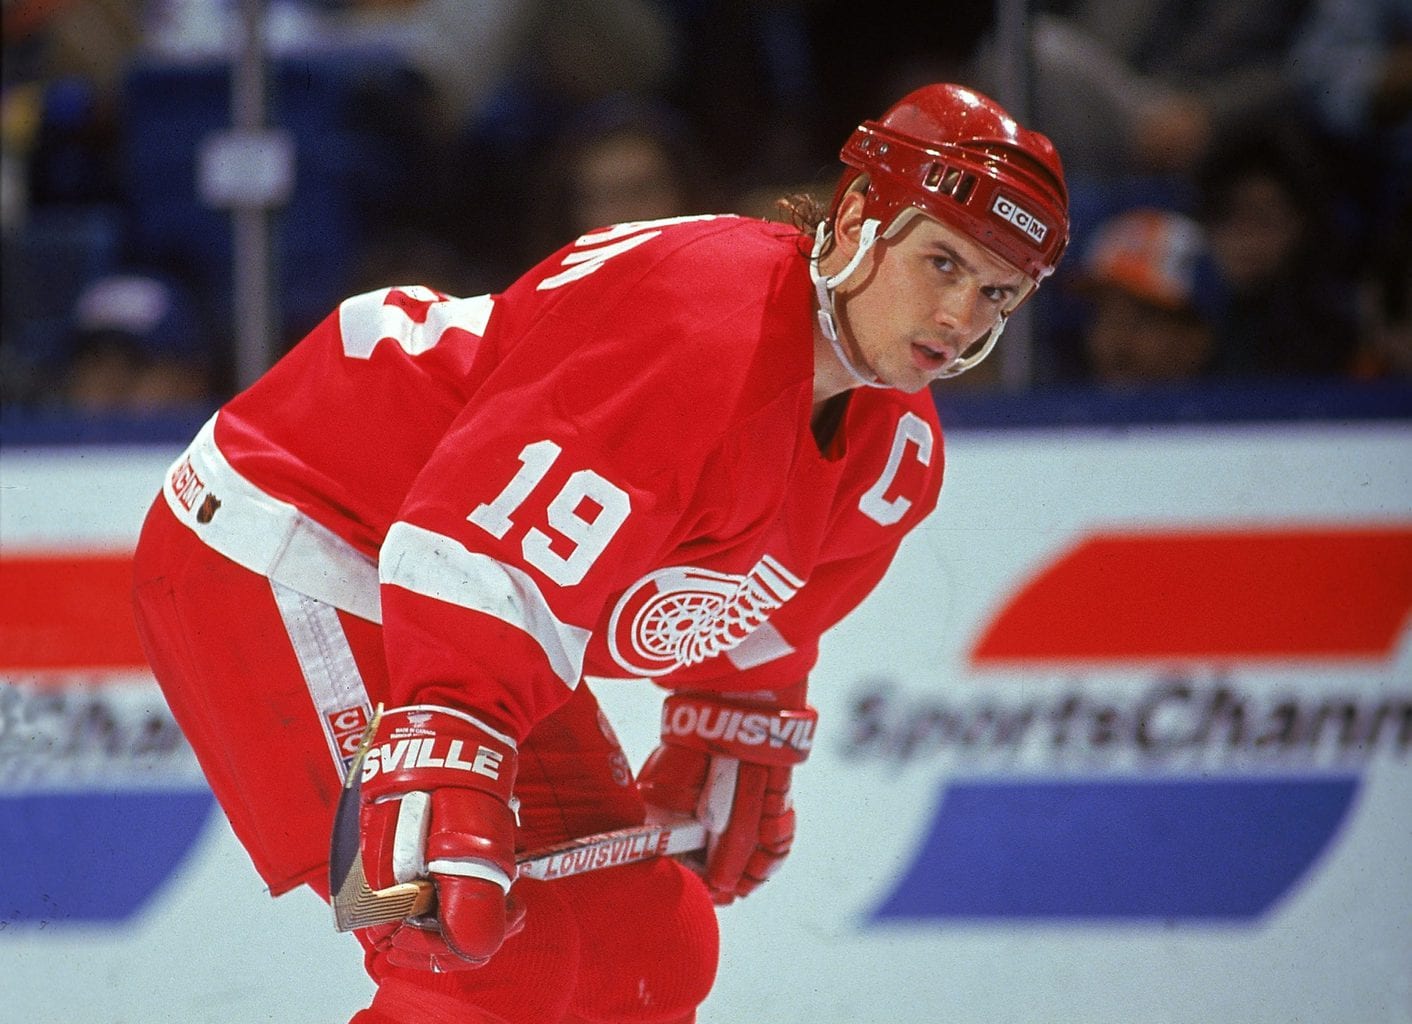
| Ted Lindsay | 0.550 | 0.233 | Y | Y | 0.416 | 0.813 | Steve Yzerman |
| Alex Delvecchio | 0.443 | 0.075 | Y | Y | 0.266 | 0.279 | Darren McCarty |
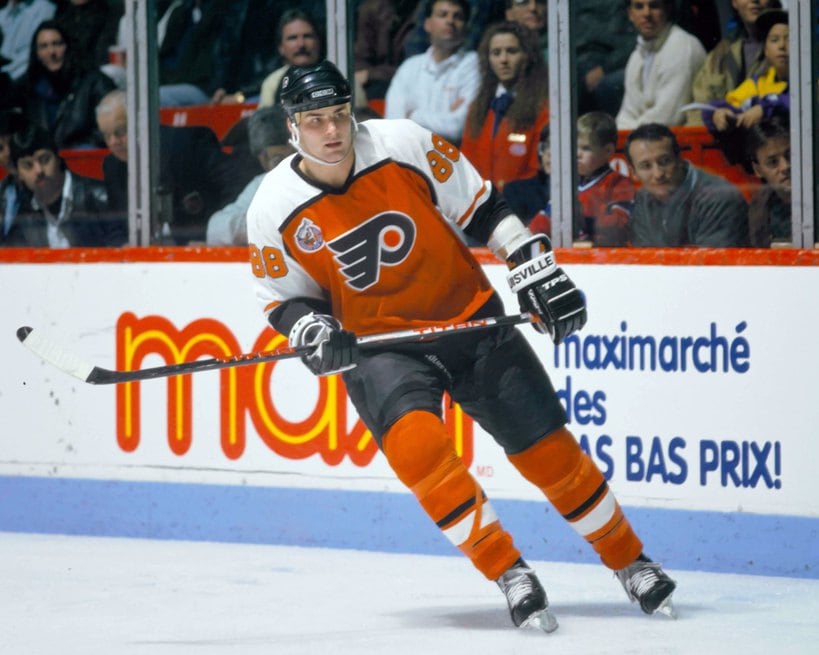
| Brendan Shanahan | 0.488 | 0.294 | Y | Y | 0.356 | 0.380 | Danny Gare |
| Red Kelly | 0.271 | 0.804 | N | N | 0.661 | 0.179 | Jeff Sharples |
| Ebbie Goodfellow | 0.568 | 0.264 | Y | N | 0.766 | 0.057 | Bob Rouse |
Ontario wins 4-3.
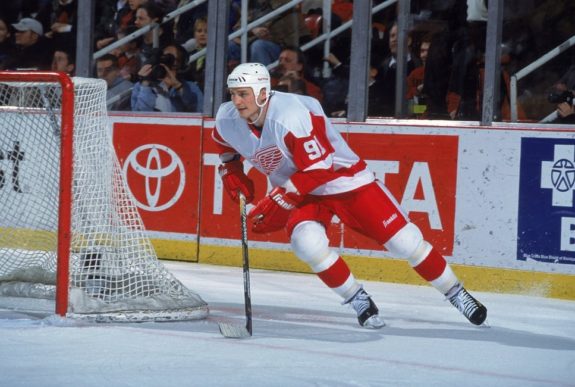
The matchup between Ontario and British Columbia resulted in the highest-scoring game of the first round. Led by Ted Lindsay, Ontario boasts arguably the strongest roster of the 16 regions, and it certainly showed when the province potted four goals against Steve Yzerman’s British Columbia team.
Dominion: (2) Quebec vs. (7) Manitoba
| Quebec | Probability | Rand | Goal? | Goal? | Rand | Probability | Manitoba |
| Marcel Dionne | 0.588 | 0.879 | N | Y | 0.080 | 0.897 | Mud Bruneteau |
| Anthony Mantha | 0.373 | 0.031 | Y | N | 0.706 | 0.286 | Darren Helm |
| Martin Lapointe | 0.329 | 0.588 | N | N | 0.782 | 0.329 | Pete Stemkowski |
| Marcel Pronovost | 0.159 | 0.258 | N | N | 0.760 | 0.091 | Jack Stewart |
| Mathieu Dandenault | 0.137 | 0.629 | N | N | 0.648 | 0.057 | Madison Bowey |
Manitoba wins 2-1 in overtime.
In thrilling fashion, Manitoba downed a powerful Quebec team in overtime. Tied at one after regulation, Mud Bruneteau scored the game-winning goal, much like he did in the sixth overtime of Game 1 of the 1936 Stanley Cup Final. One of the weaker regions entering the tournament, Manitoba moves onto the second round.
Dominion: (3) United Kingdom vs. (6) Eastern Canada
| United Kingdom | Probability | Rand | Goal? | Goal? | Rand | Probability | Eastern Canada |
| Adam Brown | 0.480 | 0.047 | Y | Y | 0.174 | 0.382 | Danny Cleary |
| Jim McFadden | 0.400 | 0.735 | N | Y | 0.437 | 0.513 | Gerard Gallant |
| Steve Thomas | 0.227 | 0.506 | N | Y | 0.343 | 0.625 | Danny Grant |
| Fred Robertson | 0.042 | 0.736 | N | N | 0.708 | 0.400 | Flash Hollett |
| Tommy Anderson | 0.185 | 0.059 | Y | N | 0.651 | 0.222 | Rollie McLenahan |
Eastern Canada wins 3-2.
Thanks to Danny Grant’s tally, Eastern Canada overthrew the crown and defeated the United Kingdom in their opening round matchup. Danny Cleary and Gerard Gallant also scored for Eastern Canada in the victory.
World: (1) Western Europe vs. (8) Scandinavia
| Western Europe | Probability | Rand | Goal? | Goal? | Rand | Probability | Scandinavia |
| Paul McLean | 0.474 | 0.809 | N | Y | 0.010 | 0.288 | Valtteri Filppula |
| Damien Brunner | 0.273 | 0.440 | N | N | 0.929 | 0.215 | Frans Nielsen |
| Thomas Vanek | 0.313 | 0.935 | N | Y | 0.137 | 0.265 | Tomas Sandstrom |
| Willie Huber | 0.224 | 0.122 | Y | N | 0.148 | 0.032 | Poul Popial |
| Uwe Krupp | 0.136 | 0.853 | N | N | 0.281 | 0.029 | Anders Myrvold |
Scandinavia wins 2-1.
Despite having one of the weakest rosters in the tournament, Scandinavia upset Western Europe 2-1 as first round action for the World Division kicked off. Valtteri Filppula scored first and Tomas Sandstrom finished Western Europe off once and for all. Scandinavia’s victory also marked the second time that an eighth seed knocked off the top-ranked region.
World: (4) Eastern Europe vs. (5) Czech Republic
| Eastern Europe | Probability | Rand | Goal? | Goal? | Rand | Probability | Czech Republic |
| Marian Hossa | 0.541 | 0.210 | Y | Y | 0.152 | 0.309 | Jiri Hudler |
| Tomas Tatar | 0.354 | 0.060 | Y | N | 0.699 | 0.475 | Vaclav Nedomansky |
| Tomas Jurco | 0.222 | 0.950 | N | Y | 0.096 | 0.474 | Petr Klima |
| Ruslan Salei | 0.027 | 0.254 | N | N | 0.396 | 0.138 | Filip Hronek |
| Sergei Bautin | 0.036 | 0.510 | N | Y | 0.061 | 0.143 | Jakub Kindl |
Czech Republic wins 3-2.
During the second game of the World Division’s first round, Czech Republic established their dominance over all of Eastern Europe with a 3-2 victory. Much to my surprise, it was actually Jakub Kindl who scored the game-winning goal for his country. Jiri Hudler and Petr Klima also tallied for Czech Republic.
World: (2) Sweden vs. (7) Michigan
| Sweden | Probability | Rand | Goal? | Goal? | Rand | Probability | Michigan |
| Johan Franzen | 0.479 | 0.607 | N | Y | 0.002 | 0.481 | Jimmy Carson |
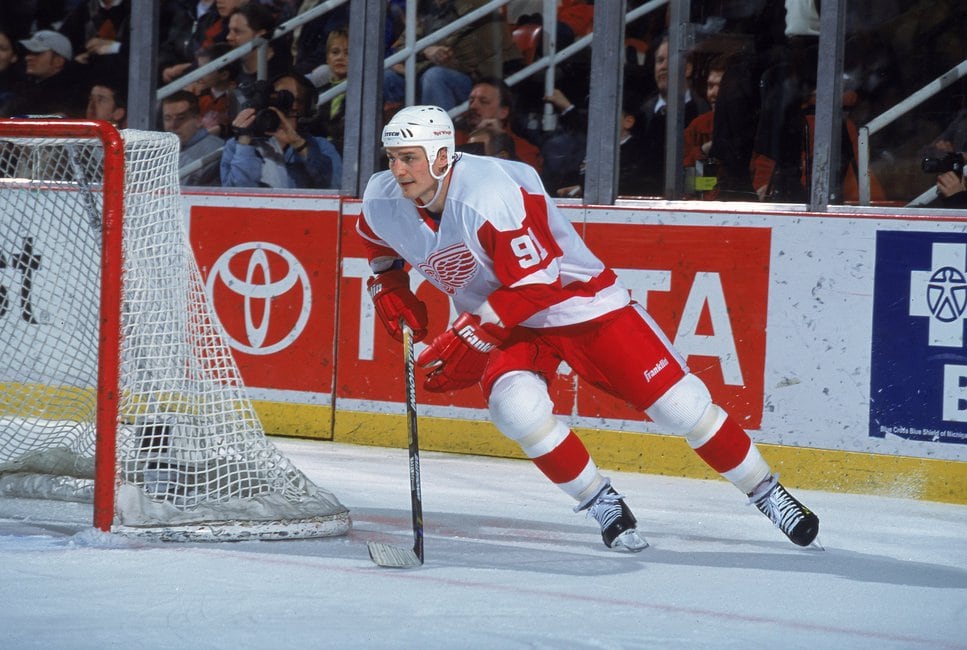
| Henrik Zetterberg | 0.573 | 0.197 | Y | N | 0.978 | 0.421 | Dylan Larkin |
| Tomas Holmstrom | 0.390 | 0.522 | N | N | 0.592 | 0.324 | Justin Abdelkader |
| Nicklas Lidstrom | 0.247 | 0.358 | N | Y | 0.006 | 0.091 | Mark Howe |
| Niklas Kronwall | 0.183 | 0.911 | N | N | 0.795 | 0.178 | Brian Rafalski |
Michigan wins 2-1.
Another upset on the world stage – Michigan downed powerhouse Sweden in their opening-round matchup. Sweden entered the tournament with high scoring probabilities across the board and plenty of leadership to go around, but Jimmy Carson and the state of Michigan had other plans. Mark Howe also scored for his birth state.
World: (3) USA vs. (6) Russia
| USA | Probability | Rand | Goal? | Goal? | Rand | Probability | Russia |
| Doug Brown | 0.238 | 0.355 | N | Y | 0.225 | 0.439 | Slava Kozlov |
| Drew Miller | 0.175 | 0.015 | Y | N | 0.935 | 0.683 | Sergei Fedorov |
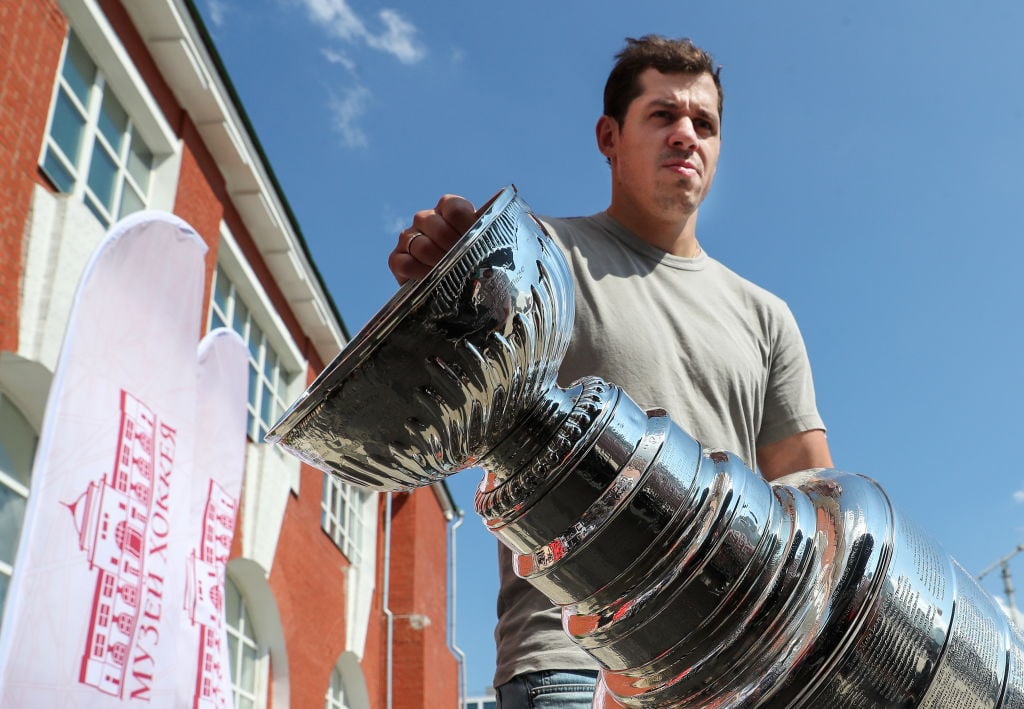
| Brett Hull | 0.451 | 0.881 | N | Y | 0.230 | 0.395 | Pavel Datsyuk |
| Reed Larson | 0.346 | 0.381 | N | N | 0.637 | 0.101 | Slava Fetisov |
| Chris Chelios | 0.076 | 0.519 | N | N | 0.231 | 0.173 | Vladimir Konstantinov |
Russia wins 2-1.
Unfortunately for Team USA, there was no Miracle on Ice repeat in this tournament. The Russians proved to be superior with a 2-1 win over the United States. Slava Kozlov and Pavel Datsyuk scored for Russia in the victory, with Igor Larionov supervising from the bench.
Second Round
The first round had a few shocking upsets. Could the second round produce even more drama?
Dominion: (4) Ontario vs. (8) Saskatchewan
| Ontario | Probability | Rand | Goal? | Goal? | Rand | Probability | Saskatchewan |
| Ted Lindsay | 0.550 | 0.922 | N | N | 0.864 | 0.700 | Gordie Howe |
| Alex Delvecchio | 0.443 | 0.056 | Y | N | 0.661 | 0.493 | Sid Abel |
| Brendan Shanahan | 0.488 | 0.529 | N | N | 0.832 | 0.323 | Metro Prystai |
| Red Kelly | 0.271 | 0.246 | Y | Y | 0.000 | 0.169 | Darren Veitch |
| Ebbie Goodfellow | 0.568 | 0.408 | Y | N | 0.517 | 0.089 | Brad McCrimmon |
Ontario wins 3-1.
It took until the second round, but we finally had our first non-one-goal game. Alex Delvecchio, Red Kelly, and Ebbie Goodfellow all scored for Ontario as they knocked off Howe’s Saskatchewan team. With the win, Ontario moves on to the Dominion Division Final.
Dominion: (6) Eastern Canada vs. (7) Manitoba
| Eastern Canada | Probability | Rand | Goal? | Goal? | Rand | Probability | Manitoba |
| Danny Cleary | 0.382 | 0.936 | N | Y | 0.487 | 0.897 | Mud Bruneteau |
| Gerard Gallant | 0.513 | 0.185 | Y | N | 0.789 | 0.286 | Darren Helm |
| Danny Grant | 0.625 | 0.901 | N | Y | 0.083 | 0.329 | Pete Stemkowski |
| Flash Hollett | 0.400 | 0.528 | N | N | 0.227 | 0.091 | Jack Stewart |
| Rollie McLenahan | 0.222 | 0.207 | Y | N | 0.554 | 0.057 | Madison Bowey |
Eastern Canada wins 3-2 in overtime.
Upstart Manitoba forced overtime once again, but could not stave off Eastern Canada this time. Gallant scored the overtime goal to send his region to the Dominion Division Final against Ontario. Defenseman Rollie McLenahan also scored for Eastern Canada, who entered overtime with a 56.4 percent chance of winning in the extra frame.
World: (5) Czech Republic vs. (8) Scandinavia
| Czech Republic | Probability | Rand | Goal? | Goal? | Rand | Probability | Scandinavia |
| Jiri Hudler | 0.309 | 0.963 | N | N | 0.537 | 0.288 | Valtteri Filppula |
| Vaclav Nedomansky | 0.475 | 0.609 | N | N | 0.623 | 0.215 | Frans Nielsen |
| Petr Klima | 0.474 | 0.429 | Y | N | 0.623 | 0.265 | Tomas Sandstrom |
| Filip Hronek | 0.138 | 0.420 | N | N | 0.380 | 0.032 | Poul Popial |
| Jakub Kindl | 0.143 | 0.020 | Y | Y | 0.001 | 0.029 | Anders Myrvold |
Czech Republic wins 2-1.
Scandinavia’s underdog run came to an end at the hands of Czech Republic, who received goals from Klima and Kindl. Through two games, the two Czech skaters lead their region with two goals apiece. With the victory, Czech Republic advances to the World Division Final.
World: (6) Russia vs. (7) Michigan
| Russia | Probability | Rand | Goal? | Goal? | Rand | Probability | Michigan |
| Slava Kozlov | 0.439 | 0.263 | Y | N | 0.985 | 0.481 | Jimmy Carson |
| Sergei Fedorov | 0.683 | 0.488 | Y | N | 0.525 | 0.421 | Dylan Larkin |
| Pavel Datsyuk | 0.395 | 0.416 | N | N | 0.366 | 0.324 | Justin Abdelkader |
| Slava Fetisov | 0.101 | 0.409 | N | N | 0.571 | 0.091 | Mark Howe |
| Vladimir Konstantinov | 0.173 | 0.421 | N | N | 0.610 | 0.178 | Brian Rafalski |
Russia wins 2-0.
Russia’s dominance over the United States continued with a 2-0 victory over Michigan, who could not avenge Team USA after they fell to the Russians in the opening round. Kozlov scored his second goal of the tournament and Sergei Fedorov also got on the board for Russia after going scoreless in their first game. Russia has only allowed one goal in two games entering the World Division Final.
Third Round
We’re down to the final four regions. Which will take home division titles and advance to the championship game?
Dominion: (4) Ontario vs. (6) Eastern Canada
| Ontario | Probability | Rand | Goal? | Goal? | Rand | Probability | Eastern Canada |
| Ted Lindsay | 0.550 | 0.038 | Y | Y | 0.133 | 0.382 | Danny Cleary |
| Alex Delvecchio | 0.443 | 0.712 | N | N | 0.921 | 0.513 | Gerard Gallant |
| Brendan Shanahan | 0.488 | 0.376 | Y | Y | 0.603 | 0.625 | Danny Grant |
| Red Kelly | 0.271 | 0.150 | Y | Y | 0.246 | 0.400 | Flash Hollett |
| Ebbie Goodfellow | 0.568 | 0.279 | Y | N | 0.659 | 0.222 | Rollie McLenahan |
Ontario wins 4-3.
In one of the highest-scoring games of the tournament, Ontario came away with a 4-3 victory, sending the province to the championship game. Lindsay, Kelly, Goodfellow, and Brendan Shanahan all scored for Ontario. Goodfellow has tallied in every game for his region so far.
World: (5) Czech Republic vs. (6) Russia
| Czech Republic | Probability | Rand | Goal? | Goal? | Rand | Probability | Russia |
| Jiri Hudler | 0.309 | 0.264 | Y | Y | 0.043 | 0.439 | Slava Kozlov |
| Vaclav Nedomansky | 0.475 | 0.895 | N | Y | 0.501 | 0.683 | Sergei Fedorov |
| Petr Klima | 0.474 | 0.513 | N | N | 0.577 | 0.395 | Pavel Datsyuk |
| Filip Hronek | 0.138 | 0.990 | N | N | 0.440 | 0.101 | Slava Fetisov |
| Jakub Kindl | 0.143 | 0.308 | N | N | 0.358 | 0.173 | Vladimir Konstantinov |
Russia wins 2-1.
Kindl’s run had to come to an end at some point. The defenseman failed to score for the first time in the tournament as Russia defeated Czech Republic 2-1. Kozlov and the Russians will face Ontario in the championship game having only allowed two goals through three contests.
Red Wings World Championship: Ontario vs. Russia
| Ontario | Probability | Rand | Goal? | Goal? | Rand | Probability | Russia |
| Ted Lindsay | 0.550 | 0.599 | N | N | 0.896 | 0.439 | Slava Kozlov |
| Alex Delvecchio | 0.443 | 0.914 | N | N | 0.820 | 0.683 | Sergei Fedorov |
| Brendan Shanahan | 0.488 | 0.760 | N | Y | 0.173 | 0.395 | Pavel Datsyuk |
| Red Kelly | 0.271 | 0.957 | N | N | 0.161 | 0.101 | Slava Fetisov |
| Ebbie Goodfellow | 0.568 | 0.096 | Y | Y | 0.028 | 0.173 | Vladimir Konstantinov |
Russia wins 2-1.
And with that, Russia takes home the championship and answers which region around the world produced the best Red Wings players. The Russian Five, Datsyuk, Danny Markov, Alexey Marchenko, Dmitri Mironov, Yan Golubovsky, Maxim Kuznetsov, Yuri Butsayev, Dmitry Bykov, and Evgeny Svechnikov reign supreme.
Final Word
After four playoff rounds and 13 simulations, Russia proved to be the dominant region for Red Wings players. This shouldn’t be a complete shock given the Russian Five’s dominance, but it was odd that they averaged only two goals per game while others scored more and still lost.
In fact, four regions had higher cumulative scoring probabilities than Russia, including Sweden, who was eliminated in the first round. Talk about puck luck. But then again, the Russian Five’s game plan was all about maximizing puck possession and creating the best—not the most—scoring opportunities. Seems fitting that they won in such a manner, doesn’t it?
1I had to bend the scoring probability rules a little bit for two players: Anders Myrvold and Sergei Bautin, who did not score in a Red Wings uniform, but were critical components for forming their region’s team. Essentially, I took Detroit’s average goals per game for the season they played in Hockeytown, divided it by 18 skaters, and estimated they were on the ice for 20 percent of the time in a given game, resulting in scoring probabilities of 0.029 and 0.036 for Myrvold and Bautin, respectively.
2In case of a tie, I summed the cumulative scoring probabilities for both teams, determined the percentage share for both teams, and generated a random number to determine who won in “overtime”. For example, the cumulative total of Ontario’s scoring probabilities is 2.32. For Saskatchewan, it’s 1.77. If the two were tied after the simulation, I’d add 2.32 and 1.77 together and determine their share of the grand total (4.09). Ontario has a 56.7 percent chance of winning (2.32/4.09), so a randomly generated number less than 0.567 would give them the win. Anything higher would equal a win for Saskatchewan.
Free Newsletter
Get Red Wings History coverage delivered to your inbox
In-depth analysis, breaking news, and insider takes - free.
Subscribe Free →