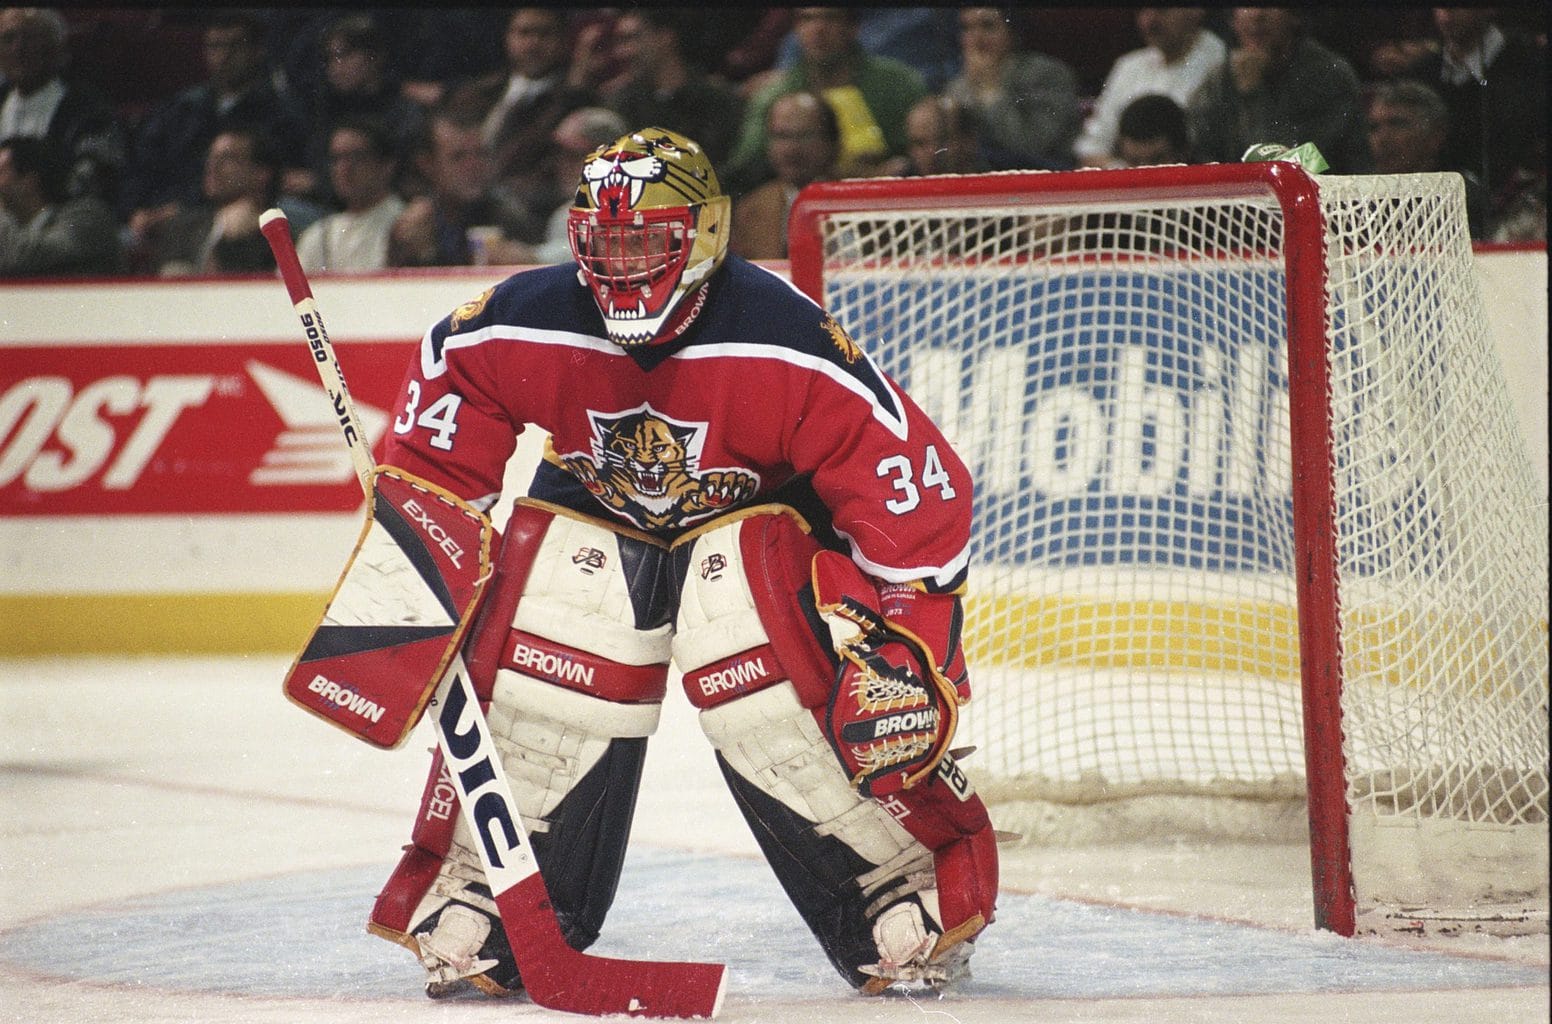
We’re only a few games into the 2016-2017 season, but Jon Marchessault has already shown why he was targeted by the Florida Panthers this offseason – he’s an analytics darling.
Marchessault posted a modest 18 points in 45 games last season for the Lightning, along with just one assist in Tampa Bay’s five playoff games.
Despite not being a reliant producer in Tampa Bay, Marchessault has caught fire early this season accumulating 8 points in his first 6 games.
Why has Marchessault been able to find success thus far in Florida?
What the Data Says
Although Marchessault only averaged 0.40 PPG with Tampa Bay in 2015-2016, he was productive with his ice time. Last season Marchessault averaged just 12:05 of ice time per game, which ranked him 10th amongst Tampa Bay forwards. Thus far in 2016-2017 his ice time has increased substantially to 17:52 per game, which ranks him 6th amongst Panther forwards.
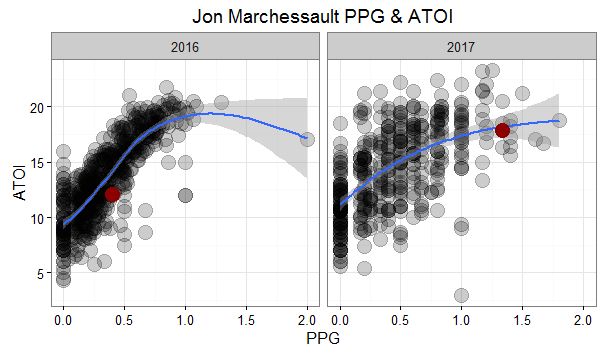
This plot shows where Marchessault stacked up against other forwards in TOI and PPG in 2015-2016 compared to thus far in 2016-2017. The red dot shows where Marchessault stands over the two seasons — it’s clear he was a strong producer relative to other players with similar ice time last year. This season with increased playing time Marchessault has increased his point total to average 1.33 PPG.
Another factor playing into Marchessault’s success is his improved linemates.
In Tampa Bay he often found himself buried on the lower lines. However, with the Panthers Marchessault has earned top line rights with the ageless wonder Jaromir Jagr and emerging star Aleksander Barkov. He was given the bump when Jonathan Huberdeau went down with an Achilles tendon injury that will sideline him the first three to four months of the season.
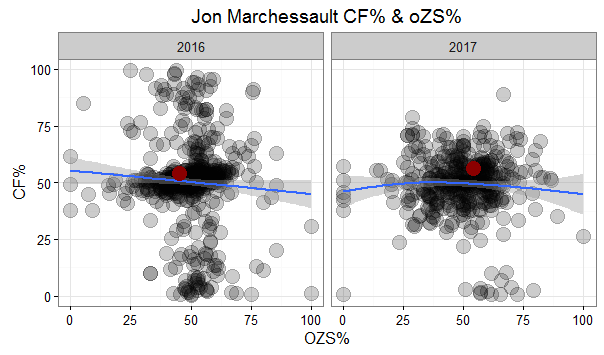
Being on the top line has rewarded Marchessault more opportunities to start shifts in the offensive zone, as shown in this plot. His offensive zone start percentage (oZS%) has increased drastically from 45% to 57.1% this season, which has resulted in more scoring opportunities.
An astonishing sign of Marchessault’s ability is his consistency amongst his possession metrics — on a lower line and with less shifts starting in the offensive zone he was still able to produce a notable CF of 53.9% in 2015-2016, which is just below this season’s mark thus far of 54.9%
Marchessault had a strong advanced statistics resume in Tampa Bay, but because of his low point total the Panthers were able to acquire him at a discount during free agency at just a $750,000 cap hit.
Marchessault is on pace for 110 points this season, and will almost certainly regress. His shot percentage currently is an astronomically high 15.8%, and he will likely lose his role on the first line when Huberdeau returns from injury. Although it’s likely his production will stagnate, Marchessault has been a gleaming of example of how a team can use analytics to find value where others don’t see it.
—
Write to codyreiff@email.com. All data in this article is courtesy of hockey-reference.com.
Free Newsletter
Get Advanced Stats coverage delivered to your inbox
In-depth analysis, breaking news, and insider takes - free.
Subscribe Free →