For part 1 in this series, see Plus-Minus Revisited, the Correction: Part 1 of 2.
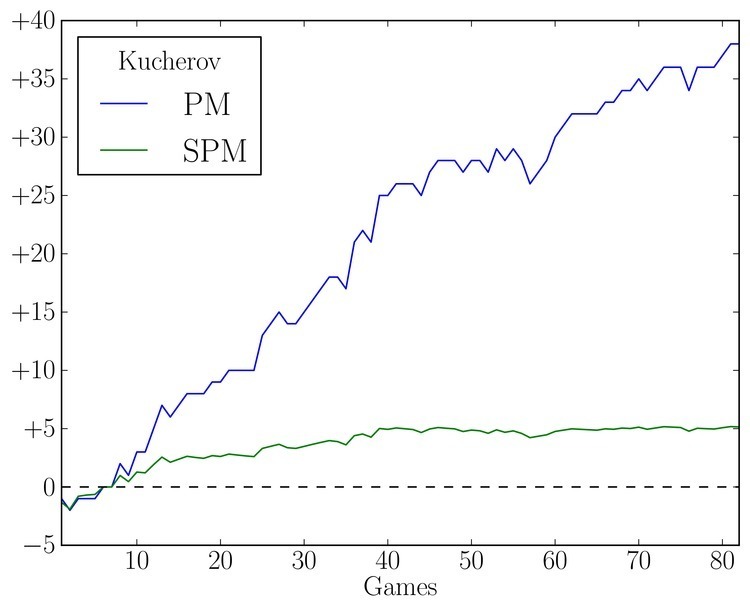
A quick review for those of you looking to not get bogged down in the details: scaled plus-minus (SPM) takes a players plus-minus (PM) and divides it by the square root of the player’s ice time (TOI). This way, a player’s SPM should approach the player’s true value over time, unlike PM which may continue to increase (decrease). Also, it tells us that players with an SPM within -1 to +1 are likely to be average players, while those with SPM > +1 (< -1) are likely to be above (below) average.
The new SPM statistic, described in part 1 in this series, isn’t meant to turn the table on any player. That said, some surprises may show up. A player with a huge PM stat after a small amount of ice time, will get a boost, while those with the most TOI will probably slide a bit.
A natural place to start examining this new statistic is this season’s PM leaders, Montreal Canadiens’ Max Pacioretty and Tampa Bay’s Nikita Kucherov at +38 each. While their PM stats are equal, Kucherov was on the ice for 325 fewer minutes than Pacioretty. Their SPM rankings are +4.57 for Pacioretty and +5.14 for Kucherov. A clear leader emerges.
Below is the new top ten based on SPM, along with their traditional PM rank.
| Player | SPM | SPM Rank | PM | PM Rank | TOI |
|---|---|---|---|---|---|
| Nikita Kucherov | +5.14 | 1 | +38 | 1 | 1226 |
| Max Pacioretty | +4.57 | 2 | +38 | 1 | 1552 |
| Tyler Johnson | +4.29 | 3 | +33 | 3 | 1327 |
| Ondrej Palat | +4.06 | 4 | +31 | 4 | 1307 |
| Rick Nash | +3.70 | 5 | +29 | 6 | 1379 |
| Jonathan Toews | +3.57 | 6 | +30 | 5 | 1585 |
| Tyler Toffoli | +3.56 | 7 | +25 | 13 | 1109 |
| Derek Stepan | +3.50 | 8 | +26 | 9 | 1236 |
| Kevan Miller | +3.49 | 9 | +20 | 29 | 739 |
| Vladimir Tarasenko | +3.47 | 10 | +27 | 8 | 1357 |
The top six spots are nearly identical. The only changes are that a first place tie is split, and Rick Nash jumps one spot on Jonathan Toews. Beyond that, some surprises start up. For example, Boston Bruins defenseman Kevan Miller had a PM of +20, good enough for 29th in the league. But he missed half the season with a shoulder injury. In a sense, SPM accounts for that and moves him up to an impressive 9th in the league.
SPM Over the Whole League
After looking at just the top ten, I looked at the league as a whole. First, as expected, 50.6% of the 882 players who played in the 2014-2015 regular season have an SPM between -1 and +1. That is, half the league is consistent with being an average player. These 446 skaters together combine for 48.4% of the ice time. So, while this group is underrepresented in terms of ice time, it is only by a bit.

On the other hand, the exceptional players have disproportionately large amounts of ice time (20.6% of the league had an SPM > +1 accounting for 27.6% of the TOI) while the players weak in SPM had disproportionately small amounts of ice time (28.7% of the league had an SPM < -1 accounting for just 24.0% of the ice time). This trend is actually the opposite of what one would expect if things were distributed randomly. That is, coaches are playing better players more, while poorer players don’t get as many minutes per game, and spending more time scratched or in the minors. Breaking this down by minutes per game (which ignores injuries, but also time spent in the AHL) yields a slightly different result. Players in the SPM < -1 group averaged 14:22 minutes per game, while players in the average group averaged 14:39 per game, just 17 seconds more. Players in the elite group with SPM > +1 averaged 17:03.
So far, I have told you that better players play more than worse players. This probably isn’t enough to convince any fan to think about SPM. But coaches seem to be thinking about it, at least somewhat. If we compare a player’s SPM or PM statistic to his minutes per game, we see that, in both cases, the trend is that higher SPM or PM leads to more minutes on the ice. But the trend is stronger when comparing SPM to ice time, as opposed to PM (a significance of 5.46 vs. 4.04).
The Bottom Line
PM is a good statistic that does correlate with ice time. That is, either coaching staffs take it seriously or, the more likely scenario, PM correlates with another statistic that is taken seriously. SPM correlates more strongly with the number of minutes per game than PM does. Moreover, SPM is a useful statistic when looking at any period of time. For example, keeping track of a reasonable value of PM midseason can be tricky: is +8 good at the all-star break? What about +4? A player’s SPM, on the other hand, should approach a constant value, not continue to grow or decrease, regardless of the timespan over which it is examined.
All data courtesy of Hockey-Reference.com.
Free Newsletter
Get Advanced Stats coverage delivered to your inbox
In-depth analysis, breaking news, and insider takes - free.
Subscribe Free →