Only 12 teams with a negative goal differential have made the playoffs since the 2004-05 NHL Lockout, which is a sample size of nine seasons. Over that time 144 playoff spots were available, therefore a team with a negative goal differential made the playoffs only eight percent of the time.
Playoff teams with negative goal differentials since 2005-06
| Year | Team | Goal Differential | Conference Standing | Result |
| 2005-06 | Tampa Bay Lightning | -8 | 8 | Lost in Quarterfinals |
| 2005-06 | Montreal Canadiens | -4 | 7 | Lost in Quarterfinals |
| 2006-07 | Tampa Bay Lightning | -8 | 7 | Lost in Quarterfinals |
| 2007-08 | Boston Bruins | -10 | 8 | Lost in Quarterfinals |
| 2008-09 | Columbus Blue Jackets | -4 | 7 | Lost in Quarterfinals |
| 2008-09 | New York Rangers | -8 | 7 | Lost in Quarterfinals |
| 2009-10 | Montreal Canadiens | -6 | 8 | Lost in Quarterfinals |
| 2009-10 | Ottawa Senators | -13 | 5 | Lost in Quarterfinals |
| 2011-12 | Washington Capitals | -8 | 7 | Lost in Quarterfinals |
| 2011-12 | Florida Panthers | -24 | 3 (SE Division) | Lost in Quarterfinals |
| 2012-13 | Minnesota Wild | -5 | 8 | Lost in Quarterfinals |
| 2013-14 | Detroit Red Wings | -8 | 8 (Wildcard) | Lost in Quarterfinals |
As you can see amongst these teams none of them were able to advance past the first round of the Stanley Cup Playoffs. Last season the Phoenix Coyotes had a minus 15 goal differential with 216 goals for and 231 goals against. This had them finish only two points out of a playoff spot behind the Dallas Stars after their late season collapse.
Coyotes scoring projections
I have made projections for each player that played a game for the Coyotes in terms of how many goals they will contribute next season. To do this I looked at their games played, goals, shots and total shooting percentage over the past three seasons. Based on no changes to the roster I project that the Coyotes will score 199 goals next season.
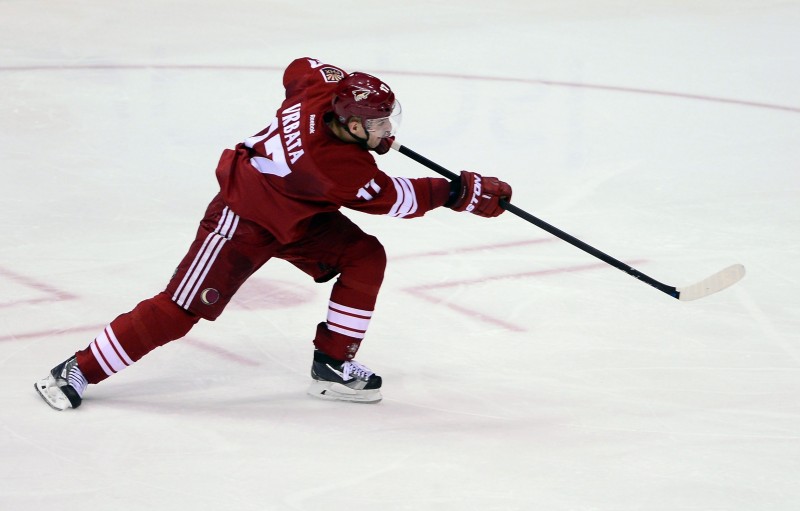
These projections are based on current Coyotes and the assumption that they will either be resigned or a similar level of production will be attained by a replacement player. The biggest impact would be losing Radim Vrbata whom I have projected to score 26 goals next season.
I also looked at the goaltenders minutes played, shots against and goals against over the past three seasons. With these numbers I have projected that the Coyotes will allow 201 goals next season. While this is an improved goal differential at minus three it will still keep the Coyotes as a team fighting an uphill battle to make the post season.
It is very likely that Thomas Greiss will not be returning to the Coyotes next season as he looks for a chance to be a starting net minder. Using the same logic I project that a tandem of Mike Smith and Mark Visentin, or similar skill level back up, will allow 210 goals next season. That widens their differential to minus 11 next year.
What is the priority for the offseason?
It is clear that the Coyotes need either need a prospect to step up and contribute or they will have to seek an upgrade in scoring via trade or free agency. Without question the wider the goal differential the better, but if the Coyotes can acquire another 20 plus goal scorer they will be in much better position to compete for a playoff spot.
Perhaps Zbynek Michalek’s brother Milan Michalek of the Ottawa Senators could be convinced to sign a contract to play in the desert. He should be a 25-30 goal contributor per season playing alongside Mike Ribeiro.
This acquisition along with potential contributions for their own prospects such as Brandon Gormley, Max Domi, etc. could push them back into competing for a spot in the second round.
Could the conclusion be drawn that the Coyotes need to upgrade their scoring be made without all these projections? Yes of course they could.
However the numbers very clearly illustrate that a negative goal differential team has an extremely slim chance of even making the playoffs. I am sure this is at the top of Coyotes general manager Don Maloney’s shopping list this offseason.
Counting on production from young guns?
See the charts below for the projections discussed above. Granted for younger players that have not played many NHL games it skews their results. However these types of players should never be expected to contribute to a certain level. It is always a big risk to take for any NHL general manager to count on immediate production from unproven NHL players.

I wholeheartedly agree that players like Max Domi and Brandon Gormley are expected to crack the Coyotes lineup next year and make a valued contribution. However with no track record in the NHL even the surest of prospects must have question marks and not be plan A when it comes to projecting an NHL lineup.
| Player | GP | G | SH | SH% | SH/GP | GP% | PRJGP | PRJSH | PRJG |
| Radim Vrbata | 191 | 67 | 601 | 11.1% | 3.1 | 90.1% | 74 | 232 | 26 |
| Shane Doan | 196 | 58 | 522 | 11.1% | 2.7 | 92.5% | 76 | 202 | 22 |
| Antione Vermette | 212 | 48 | 400 | 12.0% | 1.9 | 100.0% | 82 | 155 | 19 |
| Mike Ribeiro | 202 | 47 | 315 | 14.9% | 1.6 | 95.3% | 78 | 122 | 18 |
| Mikkel Boedker | 212 | 37 | 335 | 11.0% | 1.6 | 100.0% | 82 | 130 | 14 |
| Martin Hanzal | 168 | 34 | 407 | 8.4% | 2.4 | 79.2% | 65 | 157 | 13 |
| Lauri Korpikoski | 182 | 32 | 338 | 9.5% | 1.9 | 85.8% | 70 | 131 | 12 |
| Oliver Ekman-Larsson | 210 | 31 | 447 | 6.9% | 2.1 | 99.1% | 81 | 173 | 12 |
| Keith Yandle | 212 | 29 | 567 | 5.1% | 2.7 | 100.0% | 82 | 219 | 11 |
| Martin Erat | 186 | 27 | 229 | 11.8% | 1.2 | 87.7% | 72 | 89 | 10 |
| Rob Klinkhammer | 109 | 16 | 163 | 9.8% | 1.5 | 51.4% | 42 | 63 | 6 |
| David Moss | 156 | 15 | 315 | 4.8% | 2.0 | 73.6% | 60 | 122 | 6 |
| Michael Stone | 123 | 14 | 273 | 5.1% | 2.2 | 58.0% | 48 | 106 | 5 |
| Kyle Chipchura | 179 | 13 | 126 | 10.3% | 0.7 | 84.4% | 69 | 49 | 5 |
| Jeff Halpern | 184 | 10 | 134 | 7.5% | 0.7 | 86.8% | 71 | 52 | 4 |
| Derek Morris | 161 | 7 | 222 | 3.2% | 1.4 | 75.9% | 62 | 86 | 3 |
| Brandon Yip | 71 | 6 | 77 | 7.8% | 1.1 | 33.5% | 27 | 30 | 2 |
| Tim Kennedy | 77 | 5 | 88 | 5.7% | 1.1 | 36.3% | 30 | 34 | 2 |
| Zbynek Michalek | 155 | 4 | 197 | 2.0% | 1.3 | 73.1% | 60 | 76 | 2 |
| Paul Bissonnettte | 98 | 3 | 53 | 5.7% | 0.5 | 46.2% | 38 | 21 | 1 |
| David Schlemko | 124 | 3 | 154 | 1.9% | 1.2 | 58.5% | 48 | 60 | 1 |
| Jordan Szwarz | 26 | 3 | 25 | 12.0% | 1.0 | 12.3% | 10 | 10 | 1 |
| Chris Summers | 45 | 2 | 32 | 6.3% | 0.7 | 21.2% | 17 | 12 | 1 |
| Brandon McMillan | 53 | 2 | 63 | 3.2% | 1.2 | 25.0% | 21 | 24 | 1 |
| Connor Murphy | 30 | 1 | 30 | 3.3% | 1.0 | 14.2% | 12 | 12 | 0 |
| Andy Miele | 15 | 0 | 10 | 0.0% | 0.7 | 7.1% | 6 | 4 | 0 |
| Brandon Gormley | 5 | 0 | 4 | 0.0% | 0.8 | 2.4% | 2 | 2 | 0 |
| Lucas Lessio | 3 | 0 | 4 | 0.0% | 1.3 | 1.4% | 1 | 2 | 0 |
| Total | 2371 SH | 199 GF |
| Goalie | MIN | SA | GA | MIN% | SA/MIN | SV% | PRJMIN | PRJSH | PRJSV | PRJGA | PRJGAA |
| Mike Smith | 9469 | 4875 | 387 | 64.2% | 0.51 | 92.1% | 3156 | 1625 | 1496 | 129 | 2.5 |
| Mark Visentin | 59 | 32 | 3 | 0.4% | 0.54 | 90.6% | 20 | 11 | 10 | 1 | 3.1 |
| Other | 1744 | 922 | 842 | ||||||||
| Total | 210 GA |
Free Newsletter
Get Arizona Coyotes coverage delivered to your inbox
In-depth analysis, breaking news, and insider takes - free.
Subscribe Free →