Over the past six games, the Detroit Red Wings finally got their powerplay going, scoring seven goals in their past 25 chances (28.0%) and have seen their overall powerplay% (PP%) increase from 6.67% to 16.4%. A large part of that has been due to the improved play of the Red Wings defensemen on the powerplay. Jakub Kindl has scored two powerplay goals in the past two games and Niklas Kronwall has three PP assists in the past six games. I’ve long thought that the Wings powerplay has struggled since the departure of all-time great Nicklas Lidstrom and the underrated Brian Rafalski. The Wings used to employ an umbrella powerplay, where a defenseman stands at the center of the blue line firing shots on goal with players in front to screen and jam in rebounds. The biggest issue I’ve noted this season is that the Wings’ defensemen simply aren’t able to get their shots through to the net. This got me thinking…were Lidstrom and Rafalski that much superior at taking more shot attempts, getting more shots through to the net, and ultimately scoring more goals? If they were, are there any internal solutions for the Wings?
Red Wings’ Powerplay – Post-Lidstrom and Rafalski
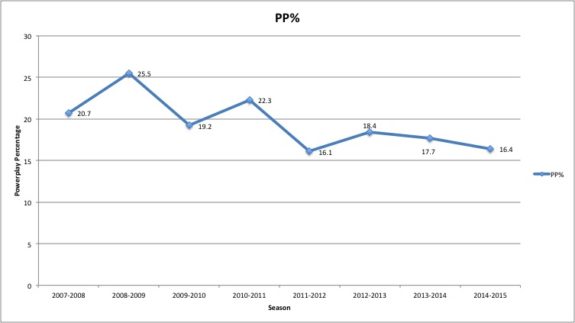
Brian Rafalski’s last season was 2010-2011 and Nick Lidstrom’s last season was 2011-2012. As you can see from this graph, there has been a pretty steep drop-off since the two of them retired. The Wings’ powerplay routinely clicked at a success rate greater than 20% but they have failed to top that threshold since both defensemen retired. This year in particular, the powerplay has looked atrocious at times, with many shots from the point never getting through on net. I decided to go back and see if the Wings were actually getting fewer shots on goal than in years past or if my eyes were just deceiving me.
This Season’s Defensemen Powerplay Shot Analysis
After going back and calculating the numbers, my eyes were definitely validated. This season, the Wings’ defensemen have combined to take 37 shot attempts. Just 13 of those shot attempts have actually made it to the net and only two have gone in. Sixteen shots have been blocked by the opposition and the remaining eight have missed wide. It’s been troubling to watch as the momentum of the powerplay gets killed (in addition to 20-25 seconds) when a shot gets blocked out high and the puck is cleared all the way down easily. Obviously it has only been 14 games and a measly 37 shot attempts so we can’t make any concrete conclusions, but we can say that this has been a troubling start. The biggest offender so far has been Danny DeKeyser, as he has taken 13 of the 37 shot attempts, but has put only two on goal with an additional eight being blocked. If you’re keeping track at home, only 15.3% of his shots are getting to the net. It appears as if coach Mike Babcock has picked up on this troubling trend as DeKeyser has seen just six seconds of powerplay time over the past three games in favor of Jakub Kindl.
While these numbers are nice to pay attention to, I wanted to frame these numbers with some context by looking at how each defenseman’s season compares to each Red Wings’ defenseman’s season from 2007-2008 and how they performed on the powerplay.
Historical Defensemen Powerplay Shot Analysis
First, I decided to look at each defenseman from 2007-2008 to present that took at least 50 PP shot attempts in that particular season. I then ranked them based on percentage of shot attempts that landed on goal.
| Season | Player | Total Shot Attempts | PP Goals Scored | % of Shots On Goal | % of Shots Blocked | % of Shots Missed | True Shooting Percentage |
|---|---|---|---|---|---|---|---|
| 2008-2009 | Niklas Kronwall | 85 | 4 | 57.6 | 25.9 | 16.5 | 4.71 |
| 2010-2011 | Niklas Kronwall | 86 | 5 | 54.7 | 30.2 | 15.1 | 5.81 |
| 2013-2014 | Niklas Kronwall | 101 | 4 | 51.5 | 27.7 | 20.8 | 3.96 |
| 2007-2008 | Niklas Kronwall | 70 | 0 | 50 | 32.9 | 17.1 | 0.00 |
| 2013-2014 | Jakub Kindl | 58 | 0 | 50 | 25.9 | 24.1 | 0.00 |
| 2007-2008 | Nicklas Lidstrom | 163 | 5 | 49.1 | 30.7 | 20.2 | 3.07 |
| 2011-2012 | Kyle Quincey | 76 | 4 | 48.7 | 38.2 | 13.2 | 5.26 |
| 2010-2011 | Brian Rafalski | 83 | 0 | 48.2 | 34.9 | 16.9 | 0.00 |
| 2011-2012 | Niklas Kronwall | 98 | 7 | 48 | 39.8 | 12.2 | 7.14 |
| 2007-2008 | Brian Rafalski | 133 | 10 | 47.4 | 39.1 | 13.5 | 7.52 |
| 2009-2010 | Nicklas Lidstrom | 163 | 5 | 47.2 | 27 | 25.8 | 3.07 |
| 2008-2009 | Nicklas Lidstrom | 147 | 10 | 46.9 | 24.5 | 28.6 | 6.80 |
| 2011-2012 | Nicklas Lidstrom | 116 | 4 | 45.7 | 32.8 | 21.6 | 3.45 |
| 2007-2008 | Brad Stuart | 84 | 2 | 44 | 33.3 | 22.6 | 2.38 |
| 2011-2012 | Ian White | 120 | 0 | 43.3 | 30 | 26.7 | 0.00 |
| 2010-2011 | Nicklas Lidstrom | 153 | 7 | 43.1 | 30.7 | 26.1 | 4.58 |
| 2008-2009 | Brian Rafalski | 119 | 5 | 40.3 | 34.5 | 25.2 | 4.20 |
| 2009-2010 | Brian Rafalski | 114 | 5 | 34.2 | 44.7 | 21.1 | 4.39 |
| 2012-2013 | Niklas Kronwall | 87 | 2 | 31 | 49.4 | 19.5 | 2.30 |
As you can see from this table, Niklas Kronwall has been simply outstanding at getting his shots through to the net. He owns the four best marks over the last seven seasons. While Kronwall is highly accurate in terms of getting his shot through to the net, he doesn’t generate the same volume of shots as Lidstrom or Rafalski. The column on the far right is True Shooting Percentage, calculated as the number of goals scored divided by the total number of shot attempts. You can see that in addition to Kronwall getting his shots through to the net, he also has a history of scoring goals at a high rate, posting two of the top four marks.
The Internal Candidates
While these inside looks at season-by-season numbers are great, I decided to expand the analysis a little further by compiling all the seasons for each player since 2007-2008 and looking at how accurate they were.
| Player | Total Shot Attempts | Shots on Goal | PP Goals | PP Assists | PP Points | Games Played | PP TOI | Shot Attempts/60 min PP TOI | PP Shots on Goal/60 min PP TOI | PP Goals/60 min PP TOI | PP Assists/60 min PP TOI | PP Points/60 min PP TOI |
|---|---|---|---|---|---|---|---|---|---|---|---|---|
| Nicklas Lidstrom | 742 | 345 | 31 | 111 | 142 | 386 | 1541.52 | 28.88 | 13.43 | 1.21 | 4.32 | 5.53 |
| Niklas Kronwall | 591 | 285 | 25 | 82 | 107 | 492 | 1280.09 | 27.70 | 13.36 | 1.17 | 3.84 | 5.02 |
| Brian Rafalski | 449 | 190 | 20 | 73 | 93 | 290 | 1107.33 | 24.33 | 10.30 | 1.08 | 3.96 | 5.04 |
| Brad Stuart | 161 | 80 | 6 | 10 | 16 | 367 | 358.91 | 26.91 | 13.37 | 1.00 | 1.67 | 2.67 |
| Ian White | 142 | 60 | 0 | 10 | 10 | 102 | 280.24 | 30.40 | 12.85 | 0.00 | 2.14 | 2.14 |
| Jakub Kindl | 127 | 61 | 3 | 12 | 15 | 226 | 303.68 | 25.09 | 12.05 | 0.59 | 2.37 | 2.96 |
| Kyle Quincey | 102 | 47 | 4 | 6 | 10 | 205 | 223.49 | 27.38 | 12.62 | 1.07 | 1.61 | 2.68 |
| Derek Meech | 55 | 31 | 0 | 1 | 1 | 121 | 113.93 | 28.97 | 16.33 | 0.00 | 0.53 | 0.53 |
| Danny DeKeyser | 39 | 18 | 1 | 3 | 4 | 90 | 128.39 | 18.23 | 8.41 | 0.47 | 1.40 | 1.87 |
| Brett Lebda | 35 | 18 | 0 | 4 | 4 | 204 | 118.99 | 17.65 | 9.08 | 0.00 | 2.02 | 2.02 |
| Brendan Smith | 29 | 10 | 1 | 4 | 5 | 133 | 80.80 | 21.53 | 7.43 | 0.74 | 2.97 | 3.71 |
| Jonathan Ericsson | 23 | 11 | 2 | 0 | 2 | 338 | 80.65 | 17.11 | 8.18 | 1.49 | 0.00 | 1.49 |
| Carlo Colaiacovo | 4 | 2 | 0 | 1 | 1 | 6 | 15.08 | 15.91 | 7.96 | 0.00 | 3.98 | 3.98 |
| Chris Chelios | 4 | 0 | 0 | 0 | 97 | 25.66 | 9.35 | 0.00 | 0.00 | 0.00 | 0.00 | |
| Andreas Lilja | 3 | 1 | 0 | 0 | 150 | 13.39 | 13.44 | 4.48 | 0.00 | 0.00 | 0.00 | |
| Ryan Sproul | 2 | 1 | 0 | 0 | 1 | 3.67 | 32.73 | 16.36 | 0.00 | 0.00 | 0.00 | |
| Ruslan Salei | 1 | 1 | 0 | 0 | 75 | 5.48 | 10.94 | 10.94 | 0.00 | 0.00 | 0.00 |
In this table we see the total number of shot attempts taken by each player from 2007-2008 to present, including the first 14 games of this season. We see how many shots on goal they had, how many powerplay points they had, their ice time, and a few different metrics. Essentially, we can see that Lidstrom took a high rate of shot attempts per 60 min of PP time on ice, put a higher rate on goal, scored more than anyone else, and has the highest rate of points per 60 minutes of PP time on ice. Obviously, we didn’t need this table to tell us that Nick Lidstrom is one of the best powerplay quarterbackss of all time. However, there are a few key takeaways from this table that I think are useful for the Red Wings this season. First, for some reason, Mike Babcock is electing not to utilize Kronwall in the same fashion that he used to use Rafalski and Lidstrom when it comes to PP time on ice per game. You can see that Lidstrom has played 106 fewer games than Kronwall in this table, but has 250+ minutes more of ice time. I think in the first table we showed that Kronwall can get the same rate of shots through to the net and that he actually scores on a higher percentage of them. I think Babcock should look to utilize Kronwall more on the powerplay, similar to what he used to do with Lidstrom. According to war-on-ice, Kronwall has been on the ice for 60.89% of the available powerplay minutes. Lidstrom on the other hand had the following numbers:
| Season | PP Time On | PP time Off | PP TOI% |
|---|---|---|---|
| 2007-2008 | 350.84 | 182.61 | 65.77 |
| 2008-2009 | 293.83 | 209.2 | 58.41 |
| 2009-2010 | 313.57 | 178.84 | 63.68 |
| 2010-2011 | 332.92 | 139 | 70.55 |
| 2011-2012 | 250.37 | 146.56 | 63.08 |
The 60.89% usage for Kronwall on the powerplay this year is a career high for him, but I think if Babcock can push him into the 65-70 range and encourage him to shoot the puck more, I think the Wings might be able to generate more from their powerplay. In addition, we can see that Brendan Smith and Jakub Kindl have been somewhat useful on the powerplay. Granted, Smith’s sample size is extremely small as he only has 80.8 minutes of powerplay time in his Red Wings career, but in those 80.8 minutes, he has 29 shot attempts, a goal and five points. He has put up points at a decent rate so far, and when you visually watch him, he has the speed and offensive aggressiveness the Wings might benefit from. I think Babcock has caught on to this as he has started to give Smith some powerplay time the past couple of games and taken it away from the ineffective DeKeyser.
In terms of shot attempts/60 minutes, the Wings haven’t had the dynamic duo on the powerplay to get shots through to the net since Rafalski retired. The data at hand shows that Kronwall can at least get pucks through at a similar rate to Lidstrom, but there is no one close to that 25 shots per mark except for Jakub Kindl and Kyle Quincey. I’m going to ignore Quincey’s numbers simply because a majority of his data came from his time in Colorado several years back when he was utilized on the powerplay more. Looking at Kindl, we see that he gets about 25 shot attempts/60 min PP, but also that he gets a decent percentage through to the net. In terms of PP points/60 minutes, he has the 4th best mark for players who have played at least 100 minutes on the powerplay. He definitely deserves more powerplay time moving forward.
I think if the Wings utilize Kronwall on the first PP unit, and make Kindl the quarterback of the 2nd powerplay unit with Brendan Smith, they have the chance to be successful. In terms of the first unit, Kronwall has the skill to play with those guys and needs to be the guy that gets pucks through to the net. On the 2nd unit, Smith is very good at pinching in to keep plays alive and staying aggressive while Kindl can fire shots from the point as the 2nd unit likes to create havoc in front of the net. I will note that the one limitation for this study is that I did not include quality of teammates played with as it is difficult to sum the quality of teammates played with over seasons when looking at specific minutes played.

The reason the shots on goal aspect is so important is this – the Wings have taken 142 shot attempts and put just 70 on goal in 87 minutes of powerplay time this season. In terms of shot attempts for per 60 minutes of powerplay time, they rank 15th. In terms of shots on goal per 60 minutes of PP TOI, the Wings rank 24th, at 48.16 shots per 60 minutes. Don’t think this is important? The #1 powerplay in the NHL belongs to Pittsburgh and it’s clicking at 37.5%. Take a guess at who’s number one in terms of shots on goal/60 minutes PP TOI. It’s Pittsburgh at 64.34. Washington has the 2nd best powerplay, clicking at 28.9%. Where do you think they rank in terms of shots on goal per 60 minutes? It’s 2nd of course, at 63.62! One of the keys to a successful powerplay is getting shots on goal.
| Team | PP% | Corsi/60 | Shots/60 |
|---|---|---|---|
| Pittsburgh | 37.5 | 106.47 (9th) | 64.34 (1st) |
| Washington | 28.9 | 119.82 (1st) | 63.62 (2nd) |
| Tampa Bay | 27.1 | 80.5 (29th) | 44.15 (26th) |
| San Jose | 26 | 111.24 (5th) | 60.01 (5th) |
| St. Louis | 24.5 | 107.67 (8th) | 58.81 (9th) |
| Philadelphia | 22.4 | 115.33 (3rd) | 62.68 (3rd) |
| Columbus | 22.4 | 95.81 (21st) | 51.33 (16th) |
| Boston | 22 | 104.19 (10th) | 55.69 (11th) |
| NY Islanders | 21.8 | 100.07 (14th) | 59.72(7th) |
| Ottawa | 21.6 | (102.89 (11th) | 48.5 (23rd) |
It’s clear that they aren’t attempting enough shots and that when they do shoot, they aren’t getting enough pucks through to the net. This is something that definitely needs to be addressed moving forward, whether that means utilizing the players that perform more, or going out and getting an external candidate. From the analysis, I think the Wings will benefit from maximizing Niklas Kronwall and utilizing Brendan Smith and Jakub Kindl more.
Corsi data retrieved from War-on-Ice
Free Newsletter
Get Advanced Stats coverage delivered to your inbox
In-depth analysis, breaking news, and insider takes - free.
Subscribe Free →