When Matthew Tkachuk entered the NHL this year, he didn’t know if he was going to stay or go back to junior. Neither did Calgary Flames’ General Manager, Brad Treliving, who had been on the fence about the final decision.
Like all rookies, Tkachuk needed to prove himself game after game and demonstrate why he deserved to stay. After all, he was only drafted four months before the 2016-17 season started. At this point, though, the 18-year-old has proven himself a worthy contender for the NHL. Scoring a goal with every 6.8 shots on goal, Tkachuk’s scoring more goals per shot on goal than Mitch Marner and Zach Werenski.
It’s no surprise the transition into the NHL is going so well. He’s the son of what many consider to be one of the NHL’s best American players, Keith Tkachuk. Tkachuk Senior was drafted into the NHL at No. 19 in the 1990 Draft by the Winnipeg Jets and retired in 2010, with 1,201 games played and more than 1,000 points.
The Tkachuk Progress Report
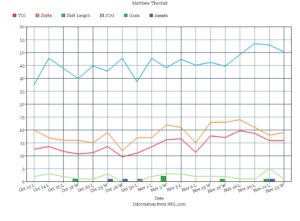
Tkachuk is definitely making progress and it’s happening in a lot of different ways. The amount of ice time a rookie sees during his first NHL season plays a significant role in his development. Some rookies are more effective when given more ice time, while others do better when given less. As you can see in the chart above, Tkachuk’s ice time has been steadily increasing since late October. Furthermore, he’s getting more shots on goal and with more shots on goal, he’s scoring goals more often. It seems that more ice time doesn’t hinder Tkachuk’s effectiveness, but rather enhances it.
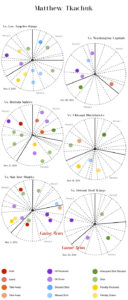
In the pie graphs above, we have Tkachuk’s on-ice events charted from six different games. Each bolded section of the pie graphs represents one period and their size reflects the TOI Tkachuk played that period. Within each slice are smaller slices which represent shifts. The size of each “mini slice” reflects the length of shift. The dots inside each pie represent an event by Tkachuk and their color indicates the event type.
Note. Dots are not placed within the shift they occurred in, but rather the period they occurred in.
The three games on the left side are games Tkachuk had a lot of events in. Games on the right side are games he had few events in. After searching for some sort of pattern between events and TOI, I’ve discovered there’s none. Based on this small sample, Tkachuk could continue to steadily increase his ice time and maintain consistent point production. Since Tkachuk’s ice time is increasing, along with his shots on goal and goals scored, it’s safe to conclude that increased ice time is a win-win situation all around.
Note. Although the samples used to project future performance are small, the patterns uncovered do indicate probabilities. For example, Tkachuk has played in 18 NHL games and has maintained a similar amount of shots on goal per minute played in both October and November. In October, he took a shot on goal once every 7:49 and in November, he took a shot on goal every 7:23. However, the number of goals he scores per shot on goal has changed drastically. It’s increased to one goal scored per 5.5 shots on goal in November, from one goal scored per 12 shots on goal in October. I’m not suggesting that December will yield a specific number of goals scored, but it’s statistically improbable for Tkachuk’s G/SOG rate to decline unless he’s injured, given a role change or incurs some other unforeseeable circumstance that causes a decline.
The Check Master
http://gty.im/615555078
Tkachuk should be teaching classes on how and when to check. He’s one of five 2016 Draft picks still playing in the NHL and we’re starting to see him as a force not to be reckoned with. Literally. He’s one of the most forceful rookies debuting the NHL this season and currently ranks first for most penalties in minutes (PIM). With 27 PIM notched under his belt already, the only other rookie who even comes close to that is Jakob Chychrun of the Arizona Coyotes. He has 23 PIM, 19 of which he got at the same time, after fighting Brayden Schenn of the Philadelphia Flyers on Oct. 27.
In the case of Tkachuk, his physicality makes him stand out. I’m not talking about his size. I’m talking about the way he uses his body. Tkachuk makes a hit every 19:55 in games won and every 10:32 in games lost.
What makes this more interesting is the rate in which he receives penalties. In games won, Tkachuk receives a penalty every 19:55, but in games lost, he only gets them every 34:13. This tells us that in games won, he makes fewer hits and receives more penalties, but in games lost, he receives fewer penalties and makes more hits. In fact, if you take a look back to the pie graphs, you’ll notice where there’s a hit given, there’s a hit received, and when he gets a penalty, he also draws one (except for the Buffalo game).
Usually, penalties occur when things aren’t going well, but for Tkachuk, when things aren’t going well, he chooses not to make them worse. For any other player who gets this many penalties, it’d be a crime to increase his ice time. Tkachuk’s seriously high number of penalty minutes don’t infringe on his team’s success, though. He actually postpone’s them for a later date and then at that time, ensures a smooth delivery.
Free Newsletter
Get Calgary Flames coverage delivered to your inbox
In-depth analysis, breaking news, and insider takes - free.
Subscribe Free →