Ron Hextall was a goaltender for the Philadelphia Flyers and now presides over his former team as General Manager. He also has a new statistic named after him. Hextally is a goaltending stat that examines the difficulty of saving particular shots.
[Check out the rest of our Hockey 201 Series]
The Original Goalie Stat Gets an Upgrade
Save percentage is one of the easiest stat to understand. It takes the total shots on goal and the total goals allowed and creates a nice, easy-to-understand, all-encompassing percentage. But with the advent of Hextally, that medieval metric now has a new level.
Not all shots are created equal. A wrist shot from the blue line is not going to make a coach sweat as much as three rebounds in the crease. Therefore, shots are now qualified into three different difficulty types: low, medium, and high. These describe the difficulty of saving a shot. Or, danger, if you will.

The Hexagons
No, this isn’t a new UFC ring-format, it’s the way we analyze shooting in the advanced stats world.
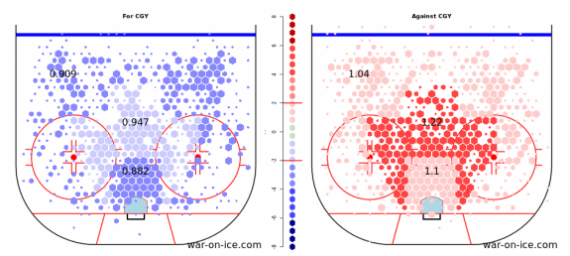
In the chart above, only three numbers are presented. These can be any number of shooting stats, but are usually shooting percentages. For instance, however, the charts above are team goals for and goals against as compared against the average of the league.
The main feature, the difficulty zones, is nicely illustrated by difference in color. A more severe red, means higher than average and a darker blue is farther below average. The bottom number, nearest the crease, is the location of the high-danger shots. The middle number, which includes the high slot and the inside areas of the dots, is the medium danger area. And the points and along the boards are the low danger zones. Goalies should put up better save percentages in the low danger zones than the high danger zones.
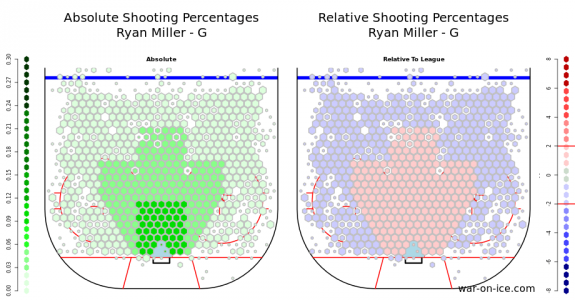
This chart is opponents’ shooting percentages against Ryan Miller. As expected, on the left, the chance of scoring goes up as you get closer to him. The right chart, shows Miller compared to his counterparts around the league. He is above average on medium and high danger shots (redder is better!) as well.
Where Are the Actual Numbers?
All of these charts and low/medium/high danger shots are put into a new type of stat. Using save percentages as a basis, we get adjusted save percentage. Individual save percentages in the three zones work the same way as the typical save percentage (goals allowed/total shots on goal) they just limit the shots and goals to their particular zones.
But then, to make an adjusted percentage, league averages come in. Say the Devils’ Cory Schneider faces twice the high danger shots as the league average. Because he is going to give up more goals than the average (no matter how much he carries that team), his high-danger goals have less weight than say, Henrik Lundqvist, whose defense keeps high-danger shots to only 75% of league average.
So, adjusted save percentages become a much fairer stat. Goalies with better defenses can now be compared to guys that are basically alone out there. Check out Hextally to see how good your man between the pipes is. Were Anton Khudobin to face the league average in each zone, his save percentage would be 1.30 points higher. Someone get Carolina some defense!
Free Newsletter
Get Advanced Stats coverage delivered to your inbox
In-depth analysis, breaking news, and insider takes - free.
Subscribe Free →