Another NHL regular season in the books concludes another year filled with strange anomalies and boggling statistics. Here’s a look back at some of the more interesting numbers that shouldn’t exist in a hockey season (but how we love them):
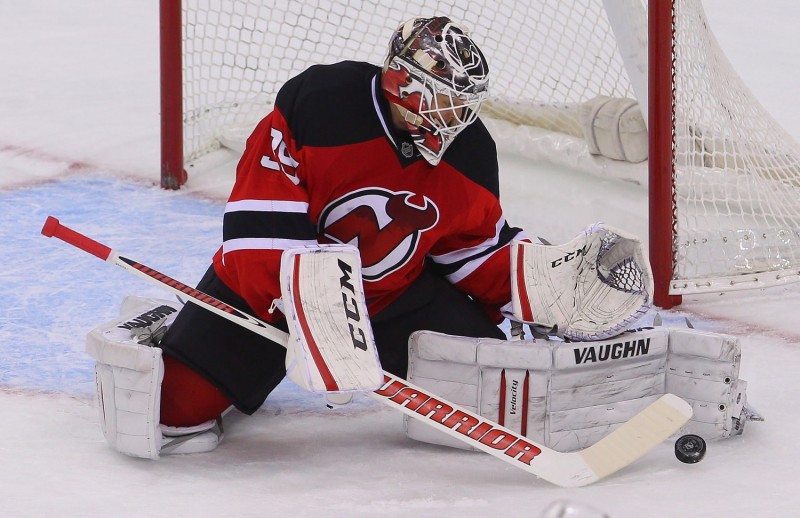
Brodeur and Schneider stats
Team chemistry is a very important aspect of building a successful roster, though the goaltending position is usually not included in that process. But for the New Jersey Devils, they might have to start thinking about finding a goalie that fits their, uh, goalie system. Cory Schneider finished the season 27th overall in terms of save percentage at .921 and T-11th in terms of GAA at 1.97. Not bad for a team that missed the postseason, but his impressive numbers led to a paltry 16-15-12 record, or a winning % of just .372 (points % of .511). Martin Brodeur on the other hand finished with less-impressive stats: a save percentage of .901 (71st) and a GAA of 2.51 (T-38th), so logically, he should have had a worse record, right? Wrong. Brodeur finished at 19-14-6, good for a .487 winning % (.564 points %), or a difference of winning about one more game of every 10. The Devils scored significantly more goals with Marty in net than Cory.
These stats have to make you wonder then, should teams actually concern themselves with finding a goalie that fits the “system”? There might be several factors at play here: Rebound control, aggressiveness, and ability to play the puck. Marty is arguably the best puck-moving goalie of all time (along with actual goaltending), so that might be the key (Marty had three assists this year while Cory had none).
Devils shootout record
Love or hate the shootout, it’s an important part of today’s NHL that can really alter playoff standings. Somebody should have gotten that memo to the Devils. New Jersey didn’t win a single shootout all season. None. Zip. Nada. And it’s not like they didn’t have a chance…they had 13 games go to shootouts, the 14th-most in the league, and they couldn’t win a single game! They allowed an embarrassing 21 goals (2nd most), good for 47% of all shots against, while scoring an equally embarrassing four goals, or just nine percent of their attempts; for reference, that’s as many goals as the Carolina Hurricanes, who had just six shootouts (2-4). Yikes.
The Devils missed out on the playoffs by five points (including the ROW tiebreaker). So if they had won 40% of their shootouts, they would have presumably made the playoffs instead of the Red Wings, who, ironically, earned exactly five shootout wins (5-9) and played almost exactly the same amount of shootouts as New Jersey (14). So does that mean that the Devils were just as deserving of a playoff spot as Detroit? Maybe, but at least they’ll be spared the pain of facing the Bruins in round one.
The Capitals and the shootout
Contrasting from the Devils, the Washington Capitals loved the shootout. In fact, it was basically all they did. 25.6% of all their games went to the skills competition. Yes, if you went to a Washington Capitals game, there was about a one-in-four chance that you’d watch 65 minutes of hockey plus the shootout, which I guess is great if you paid for a ticket. However, let’s take a look at how ridiculous this stat is. The Capitals had just 28 ROW. For context, that’s the same number as the Calgary Flames. Yeah, so essentially they were just as good at actual hockey as the Flames. They weren’t even great in the shootout, going 10-11 and allowing the most goals of any team (28). Fortunately for the sanity of every non-Capitals fan, Washington failed to make the playoffs, because what a sham that would be.
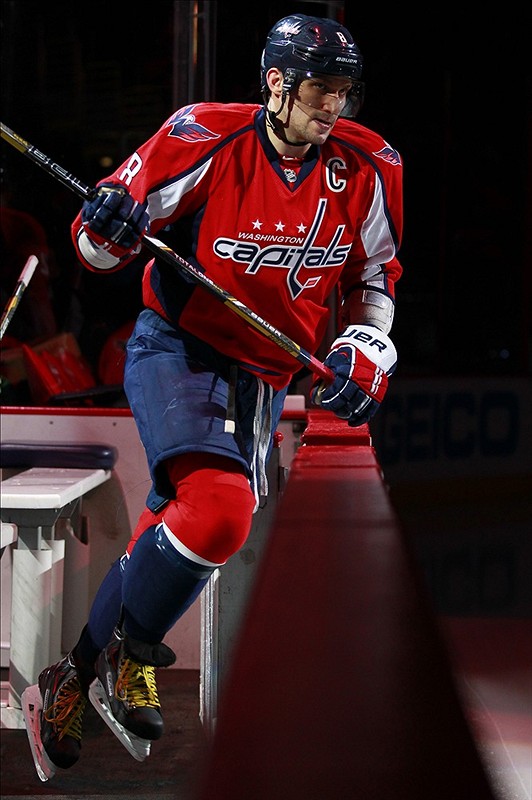
Alexander Ovechkin’s stats
But we aren’t done with the Caps just yet. Alex Ovechkin, once considered one of the two best players in hockey, had a very interesting year. He captured his fourth Rocket Richard Trophy (most goals) in seven seasons with a very impressive 51 goals (second place was Corey Perry with 43). But on the other end of the spectrum, he finished third worst in terms of another telling stat: a plus-minus of -35. How is that possible? How can a player lead the entire league in the most illustrious offensive category and finish at the bottom in terms of five-on-five differential? It’s quite obvious: Ovechkin, like the rest of the Capitals, thrived on the power play. “The Great Eight” scored a league-high 24 PPG (eight more than 2nd place) and 39 PPP on the team’s #1 ranked power play (tied with Pittsburgh), which clicked at a 23.4% percent rate. Meanwhile, they finished 23rd in terms of five-on-five differential at a terrible .90. Ovechkin’s numbers when paired with their shootout record reflect the state of Washington hockey over the past year: they weren’t actually very good at all.
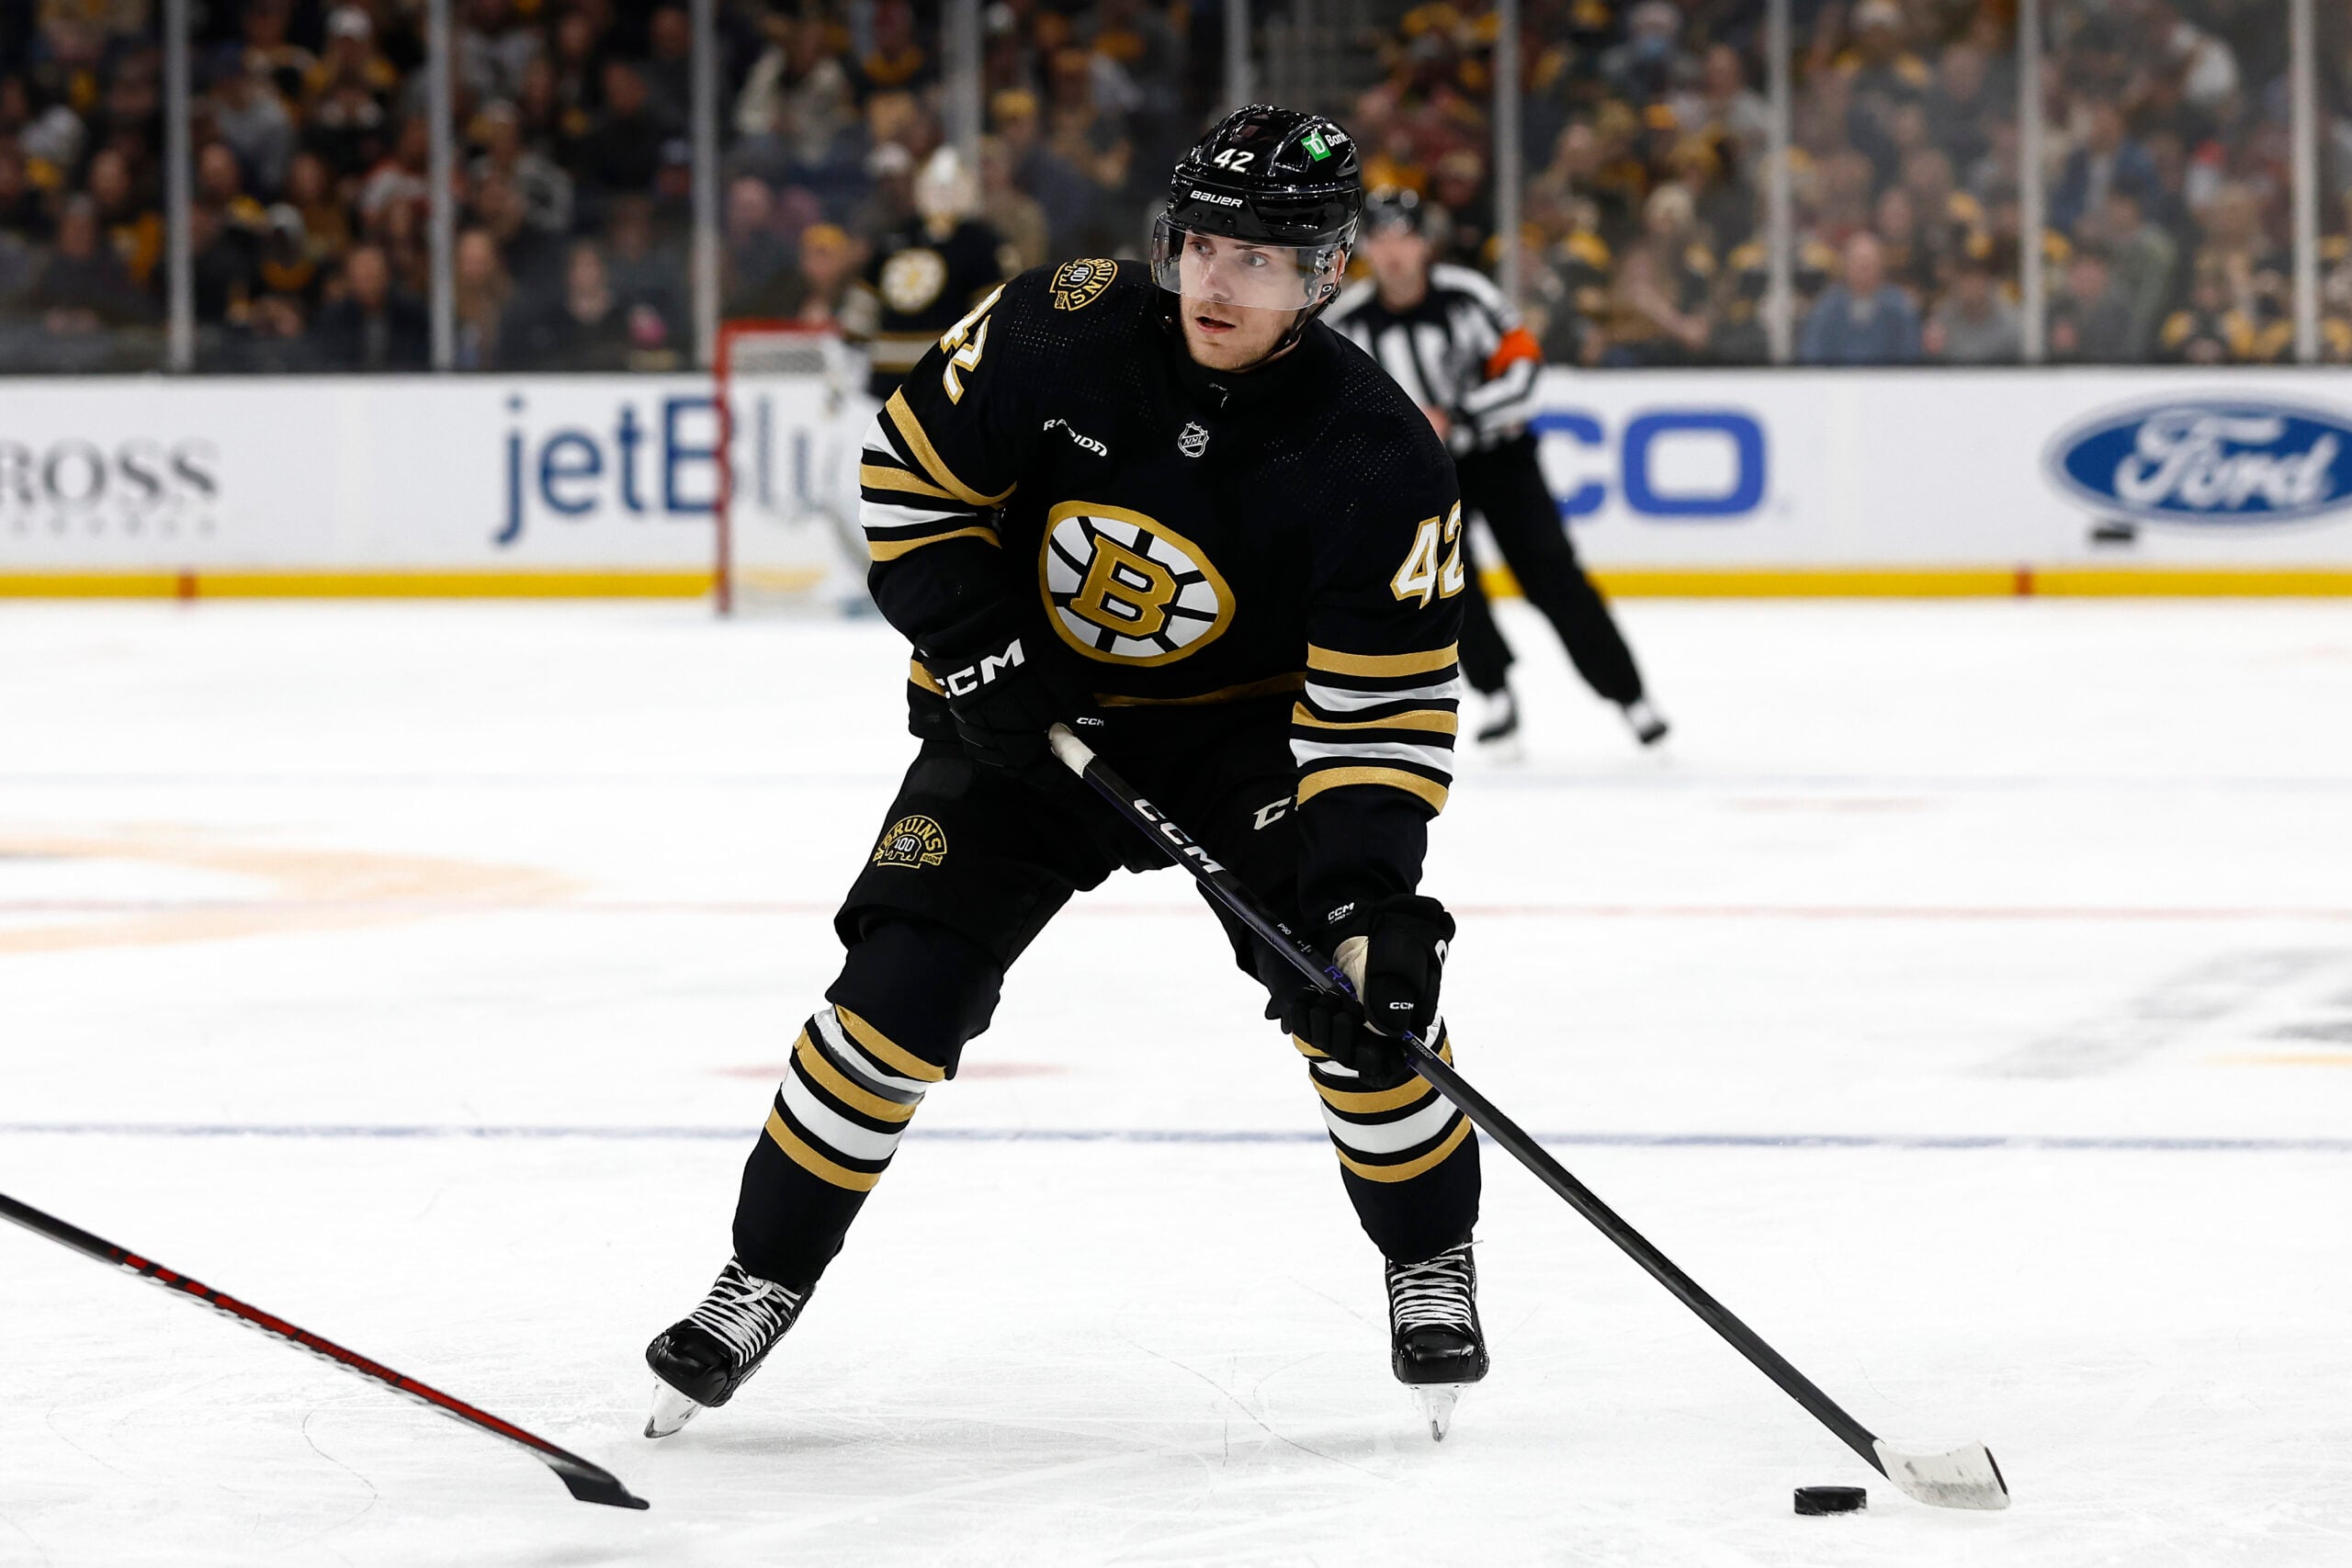
Bruins power play
Speaking of power plays, The Boston Bruins had a very successful power play this year that improved immensely from the previous season, but they didn’t have much opportunity to showcase their new weapon, especially at home. Boston finished 3rd in terms of power-play conversion rate at an impressive 21.7%, but they finished 13th in terms of actual power-play goals. Why? They simply didn’t draw many penalties. They had 230 total opportunities, good for the fewest in the league.
But what might be even more interesting is their special teams disparity when at home: They had 112 opportunities at home but were shorthanded 138 times. Keeping those numbers in mind: They had the worst difference in PP time minus PK time at home at…negative 53 minutes and 18 seconds. The second lowest total? 18:34 (Senators), followed by 18:33. Of course that’s because they had a great PP and a very good PK (8th in the league at 83.6%), but their difference on the road was actually 29th at -70:22 (Senators were last at -79:13). Aren’t you supposed to get the calls in your own arena?
Second period scoring
Out of the three periods, 17 teams scored the most goals in the second – more than half (six teams scored the most in the first, seven in the third). The easiest explanation for this figure is that the long changes really affect teams in that it’s much more difficult to make a simple line change. You’ve probably seen a team get pinned in their own end during the second, unable to make a change because it’s that much further to the benches, whereas the offensive team can pretty much swap players from the offensive blue line, and that leads to tired players and goals. Given this data…if the NHL wants to increase scoring and offense, would it not be a good idea to apply the long changes in every period? Just something to think about.
Rangers road success
Home-ice advantage is something most teams desire, but for the Rangers it’s just another fancy term. While New York finished 11th in the league for wins at 45, they finished tied for the second-most road wins at 25 (25-14-2). Conversely, they finished 21st in home wins with just 20 (20-17-4), and that difference of five wins is all regulation/overtime wins. That’s a difference of eight points. For reference, the only team to finish with more points on the road than at home were the Ottawa Senators with a difference of four points (19-14-8 on the road, 18-17-6 at home), though that’s just a win difference of one. (Interestingly, the Kings finished with identical records home and away at 23-14-4).
Why did the Rangers have so much success on the road and so little at home? The poor lighting at MSG? The stress of living in New York? The impatient fans yelling “shoot!” on the power play when the puck is behind the Rangers net? Who knows, but it’s a strange occurrence rarely seen in any sport. And unfortunately for them, they’ll have home-ice advantage in their first-round matchup against the Flyers.
The Sabres are terrible
Yes, it’s not news that the Sabres were terrible, but that doesn’t mean we can’t come up with some interesting numbers to show just how awful they were this season.
- They scored just 154 total goals. For reference, the Bruins scored 104 in the third alone.
- At a 5-on-5 goal differential of .59, they gave up nearly twice as many even-strength goals as they scored. Their overall goal differential was -91.
- They won 14 games in regulation/overtime…just 17% of all their games.
- Buffalo earned 52 points in 82 games; 17 teams finished with more than that last season…the lockout-shortened season that featured 48 games for each team.
- Those 52 points are the worst in the post-lockout era, and the worst since the 2000-01 season when the Islanders also earned 52 points…and they earned those points without the benefit of the shootout. You know, the time where games ended in a tie. Go back a year further, and the Sabres ROW is matched by the expansion Atlanta Thrashers (14 wins, 38 points).
- They were mathematically eliminated on March 17. They played 14 games that didn’t matter.
Bonus:
- David Clarkson, who warrants a cap hit of $5.2 million, was suspended for more games (12) than points he scored during the season (11). Yes, the suspension happened during the preseason, but you’d probably hope for more out of your $37 million man. (Credit to Reddit user chemicalxv for the stat.)
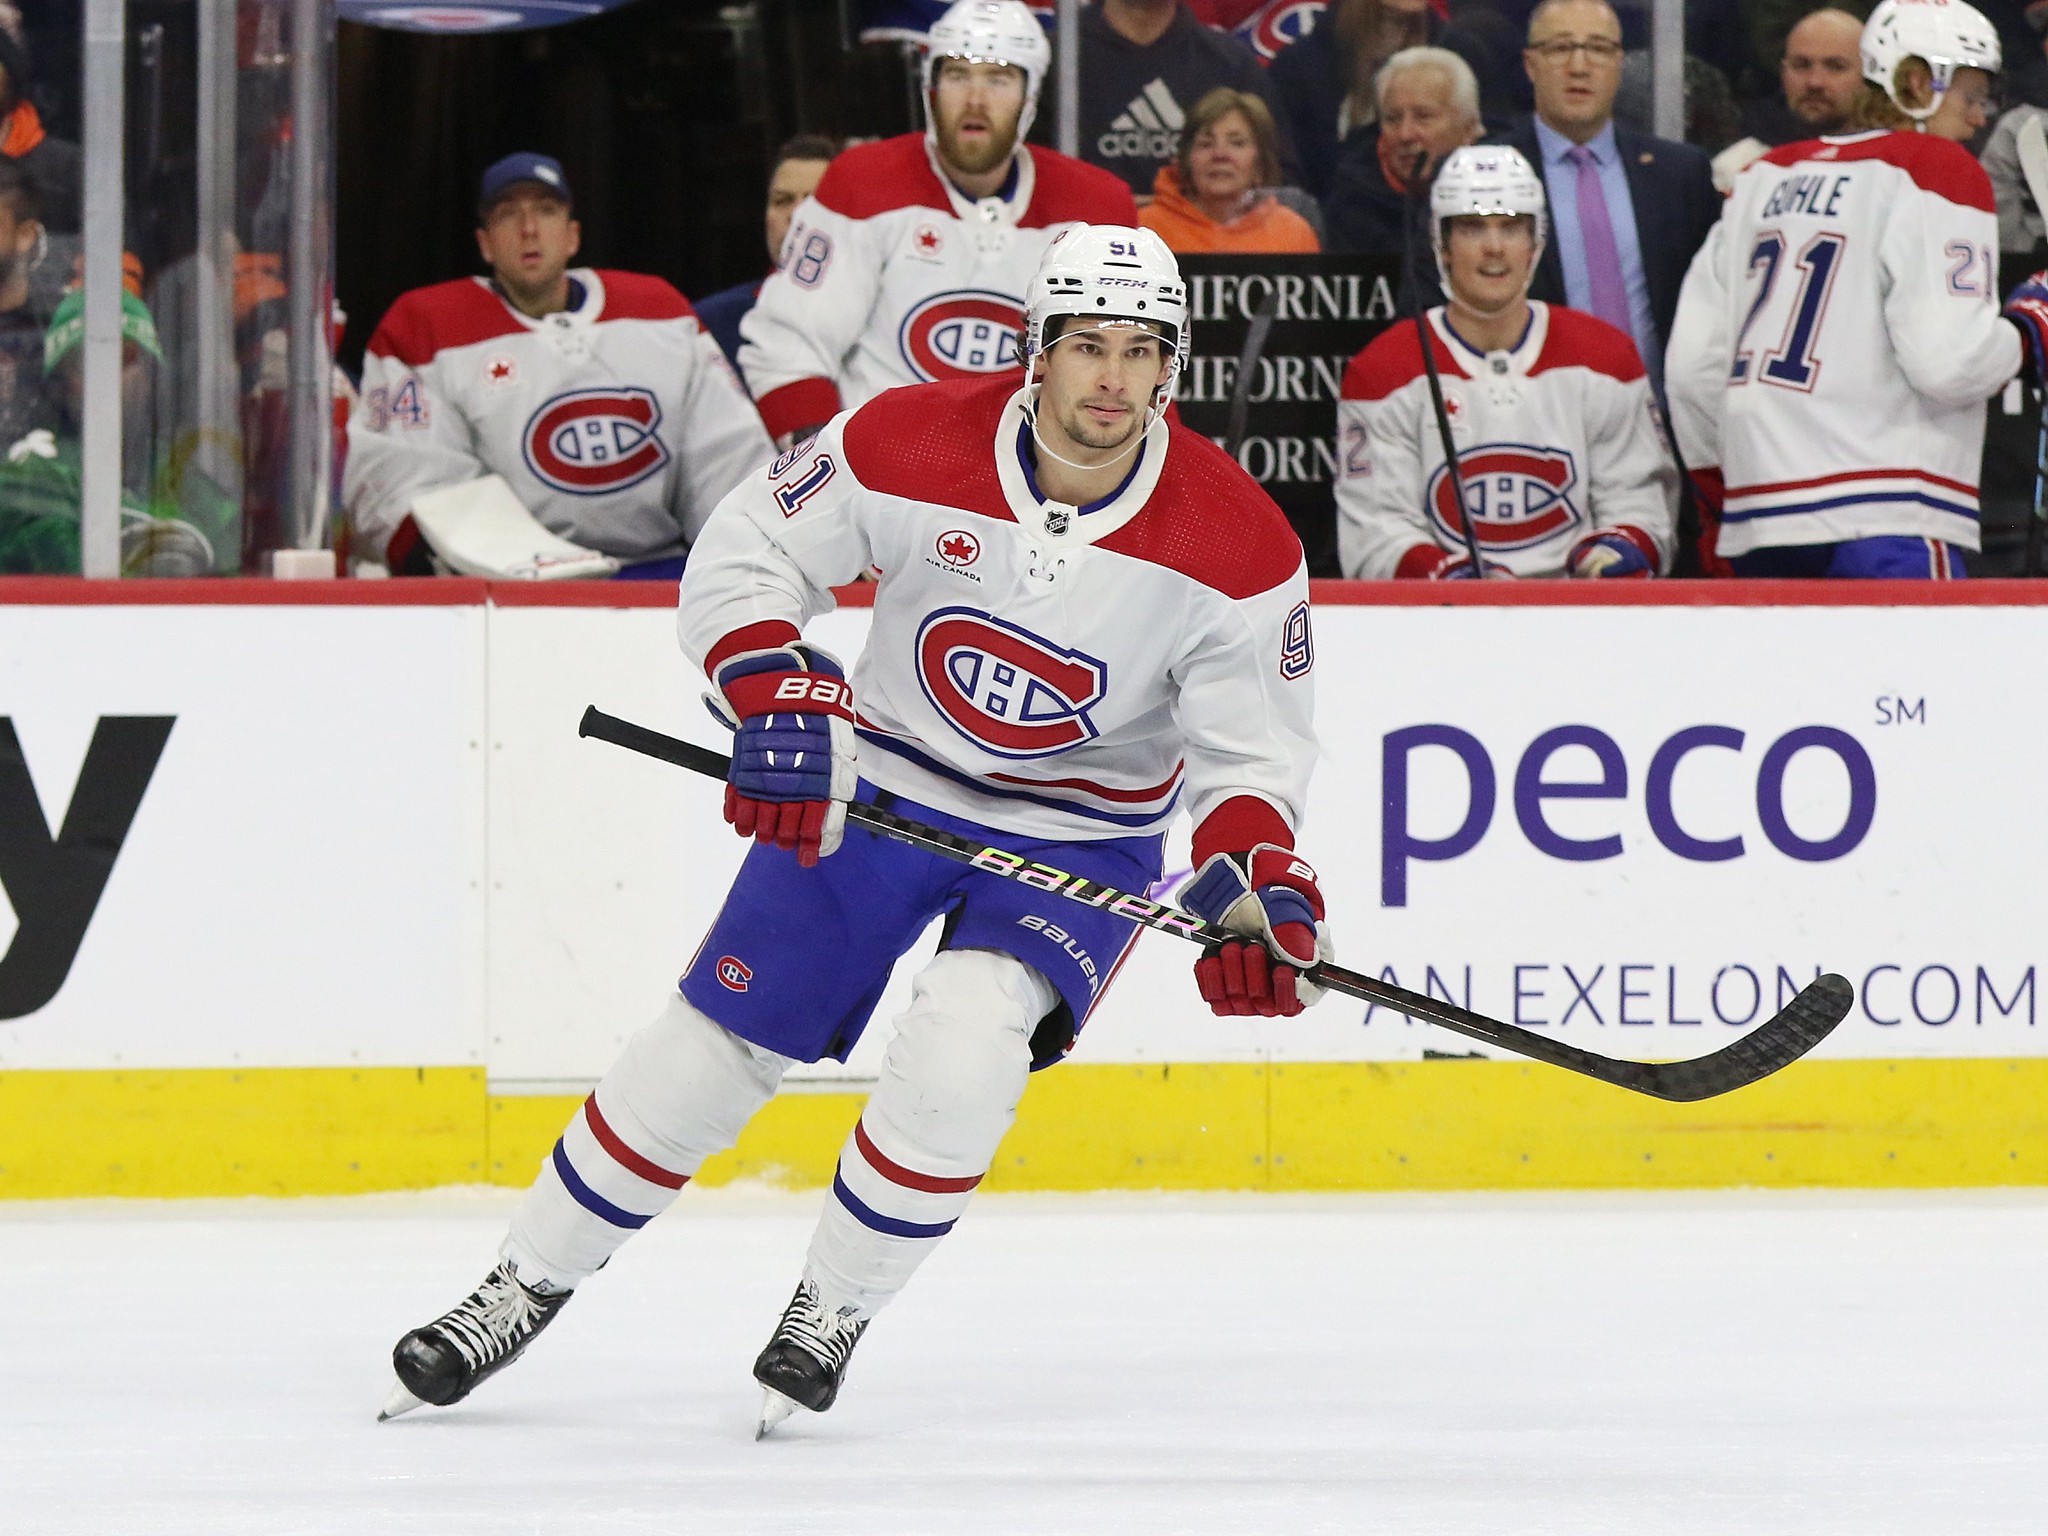
- On February 6, Max Pacioretty set an NHL record by attempting two penalty shots in the same period. He missed both, but that didn’t stop him from recording a hat trick the same night.
- Nathan Horton recorded a goal in a game in which he recorded exactly zero minutes and zero seconds of ice time. Wait, what? If you recall, Rich Peverly collapsed on the bench on March 10 in a game between the Stars and Blue Jackets. Thankfully, Peverly was OK, but the game was put on hold until a month later (April 9). The score at the time was 1-0 Columbus, and the league decided to carry that score over to the “rematch.” Since only a few minutes had passed, and since they wanted fans to get their money’s worth, that 1-0 score carried over to the next game, which was played in full (60 minutes). The player who scored the goal? Horton. His goal was officially “registered” at 00:00 of the first period. However, Horton was injured and did not play in the rematch (The Jackets won 3-1).
Free Newsletter
Get Hockey History coverage delivered to your inbox
In-depth analysis, breaking news, and insider takes - free.
Subscribe Free →