Advanced stats is quickly gaining interest in the NHL. From the hardcore fanatic to the amateur scout, analytics are taking center stage in the world of hockey and we’ve barely scratched the surface. Among those who have, the Arizona Coyotes have been placing a lot of emphasis on analytics to measure the progression of their players, especially their rookies. Last year, the Florida Panthers posted part-time, statistic-based job postings on their website in an effort to invest more in their analytics department. When it comes to the Toronto Maple Leafs, though, there seems to be a disconnect. Contrary to Maple Leafs Hot Stove, this may be because the Leafs place little emphasis on the rising trend.
Yes, the use of analytics in business is a rising trend and sports entertainment isn’t the only industry exploring it’s possibilities either. New concepts in behavior analysis are making ways into every crack and crevasse of business and mainstream media. These practices can be seen in the new tv show series Bull, which demonstrates the way analysis of human behavior can be used to create winning strategies in court trials. Data-driven marketing campaigns have become the forefront of this generation’s digital marketing and apparently Donald Trump defeated Hilary Clinton using predictive analytics.
In an article I published earlier this month, ‘Time-on-Ice Contributions to Rookie Development’, I discovered that some rookies perform better when they get more time on ice (TOI), while others perform better when they get less. For example, in the month of October, this was especially clear with Zach Werenski and Joel Eriksson Ek. Although Werenski had a P/GP rate of 0.86, he registered a point every 25:30. Eriksson Ek had a P/GP rate of 1.00 and registered a point every 10:30, yet he played exactly 100 minutes less than Werenski that month.
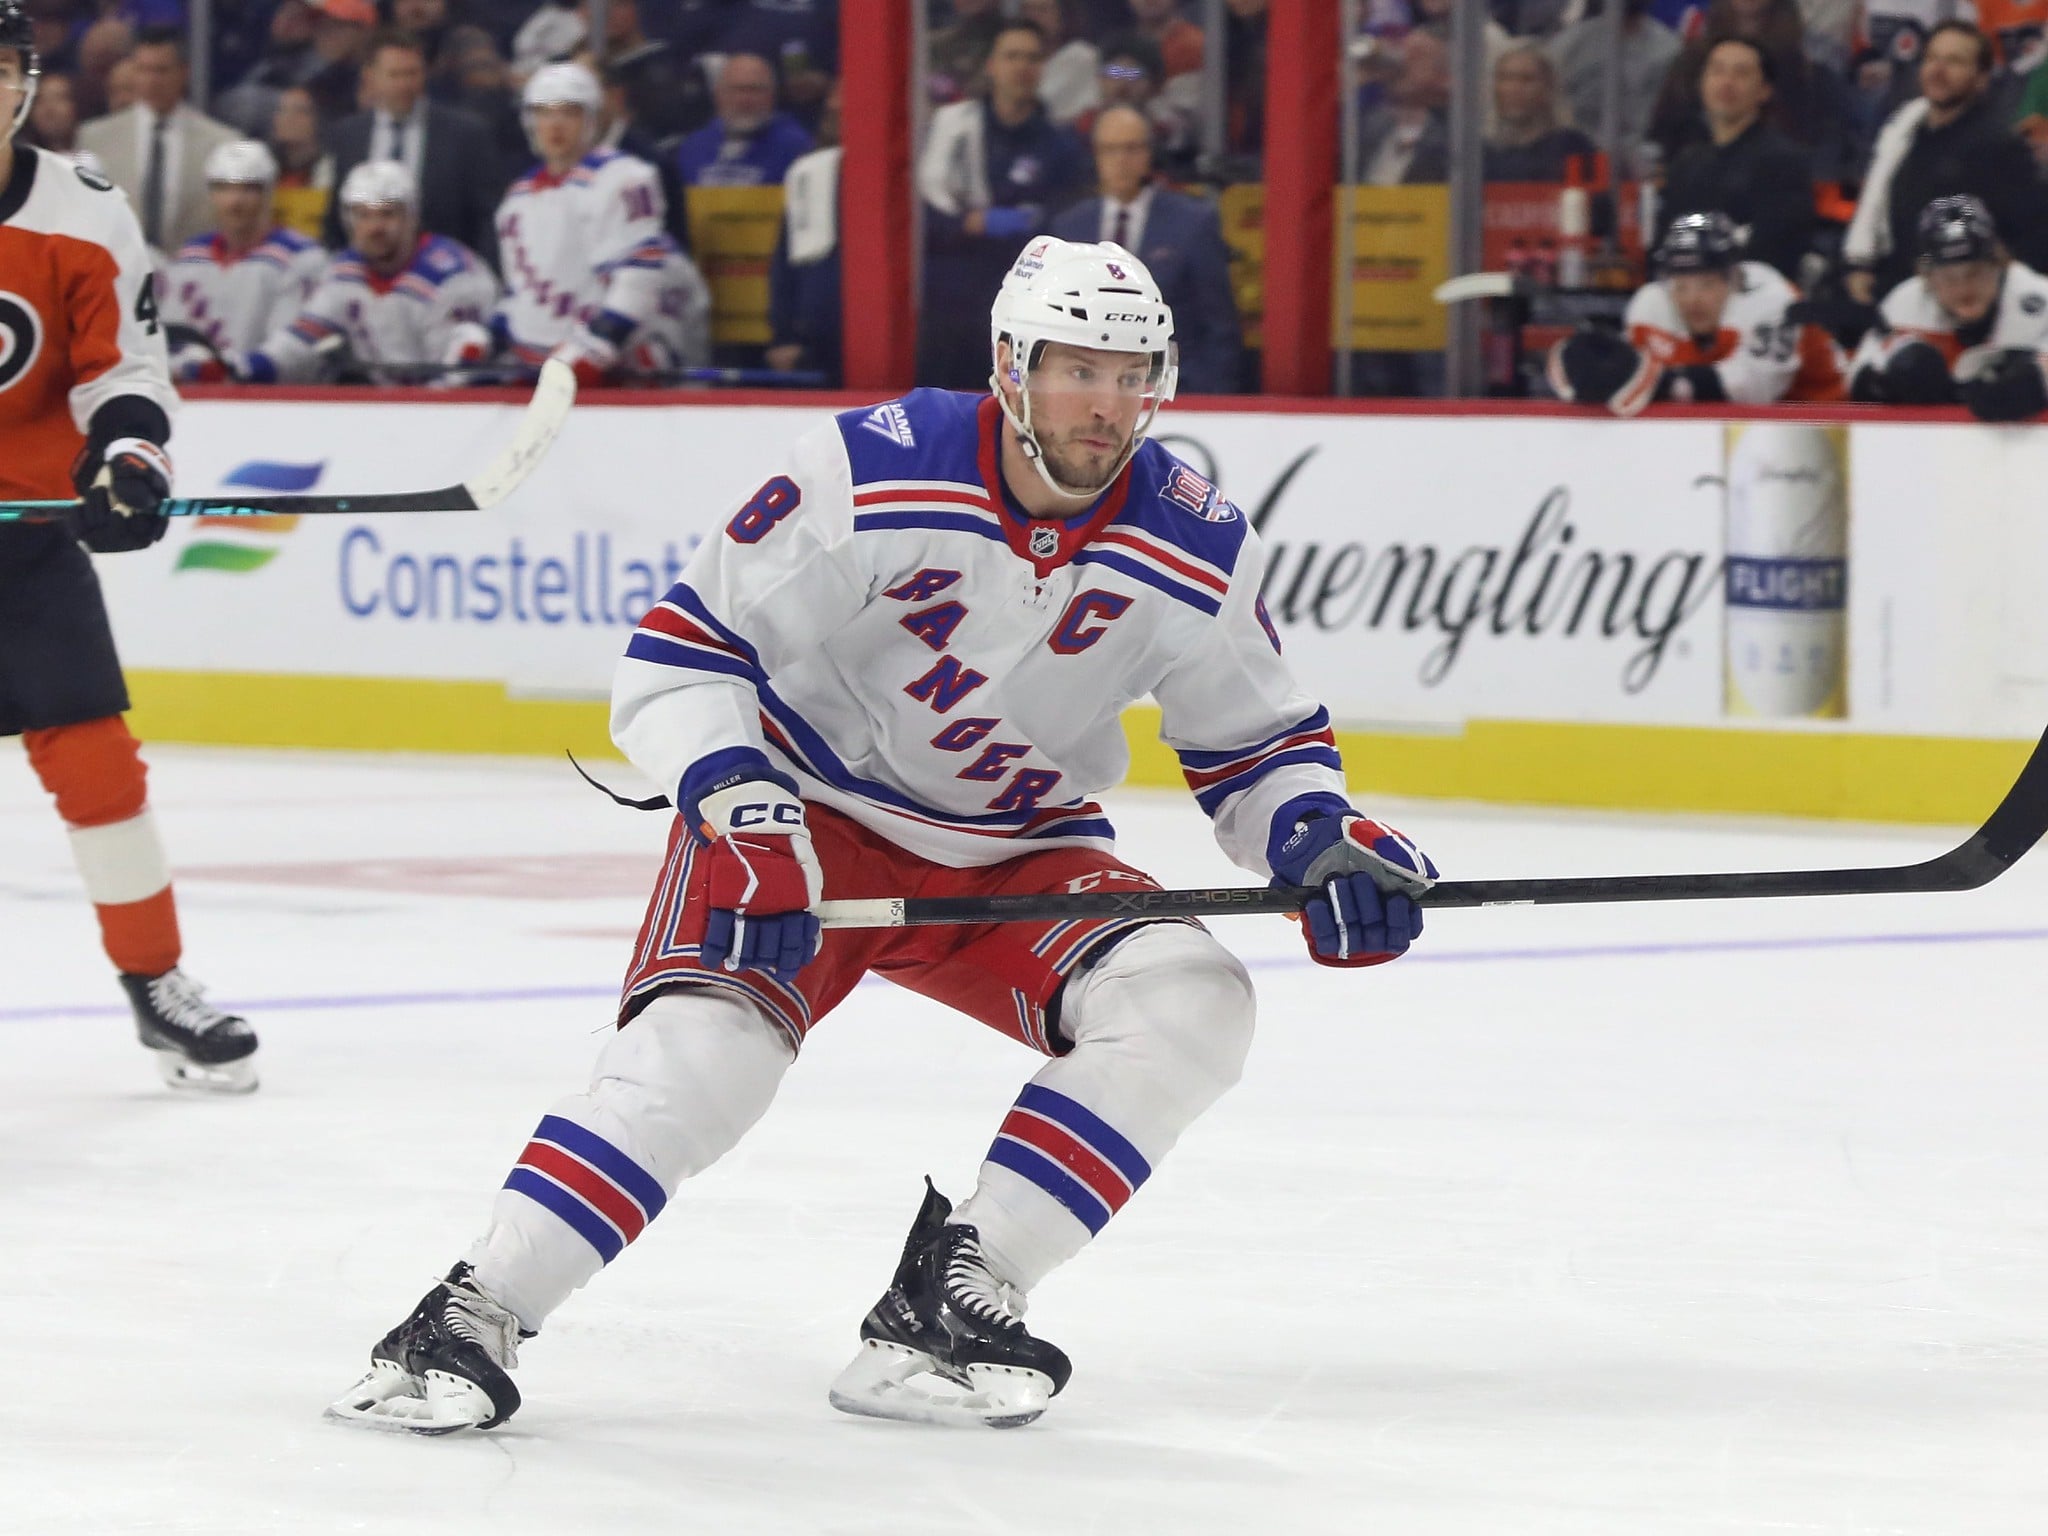
Mitch Marner vs Travis Konecny

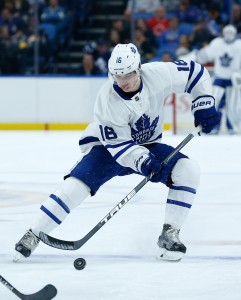
Mitch Marner of the Toronto Maple Leafs and Travis Konecny of the Philadelphia Flyers are both rookies drafted in 2015, who’ve debuted the NHL in the 2016-17 season. Of all rookies who’ve made their debut’s this season, no two players are more alike when looking at the numbers. However, a deeper analysis shows they differ dramatically. Let me explain.

Right now, Marner registers a point every 20:55, while Konecny registers a point every 25:14. Marner takes a shot on goal (SOG) every 6:06, while Konecny takes a SOG every 6:38. Marner scores a goal every 8.2 times he shoots on goal, while Konecny scores a goal every 9.5 times he shoots on goal. Marner gets an assist every 35:50, while Konecny gets an assist every 42:04.
 *Shift length is measured in seconds. **Time on ice (TOI) is measured in minutes.
Observation #1
As you can see in the graph above, Konecny has seen his time on ice (TOI) gradually increase since his NHL debut, and so have his goals. For him, more ice time generally means more shots on goal (SOG) and more shots on goal means more goals scored. When his ice time increases, his point-production increases too.
Observation #2
Konecny is also getting more goals now and fewer assists than in October. Although his overall shots on goal per game played (SOG/GP) hasn’t changed, he may be undergoing a role change. In some games, he’s not getting any shots on goal, while in others, he’s getting up to five. In games that he scored, though, he had one to three more shots on goal than in games he didn’t score.
Observation #3
Finally, Konecny alternates his number of shifts and length of shifts every other game, playing more, shorter shifts and then fewer, longer shifts. This is a clear pattern seen in many of this season’s first-year rookies.
Mitch Marner’s Development Patterns

When it comes to Marner, his progression is quite different. Generally, when his shift length dips, he registers points (assists and goals). Beginning November, Marner has also alternated between more shorter shifts and fewer longer shifts per game.
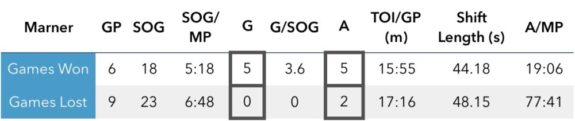
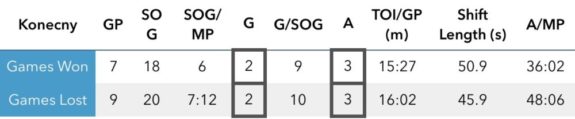
*SOG/GP = Shots on goal per game played ** G/SOG = Goal per shot on goal *** A/MP = Assist per minute played
In games lost, Marner has never scored a goal, yet he maintains a similar number of shots on goal. Although Konecny only scores a goal every 9-10 shots on goal, his shot accuracy is not affected when his team is winning or losing. In fact, Konecny gets just as many goals and assists in games won as he does in games lost.
Interesting, right?
In games won, Marner scores a goal every 3.6 shots on goal and gets an assist every 19:00. In games lost, he doesn’t score at all and decreases his assists to one every 69:00. He also plays an average of 1:20 more in games lost.
Vulnerabilities in Leafs’ System
By comparing strengths and commonalities in teams the Leafs have faced, we can better understand their areas of weakness and vulnerabilities. Teams that beat the Leafs this season rank above league average in the following areas:
- Blocked shots (NYI, OTT, MTL, PIT, WPG)
- Backhanded shots (OTT, PIT, MTL, MIN, WPG, LAK, NYI, TBL)
- Slap shots (CHI, TBL, LAK, WPG, NYI)
- Wrist shots (WPG, PIT, LAK, NYI, MTL, CHI)
- Slap shot goals (MTL, CHI, LAK, TBL, NYI, PIT)
- Power play time (WPG, CHI, TBL, LAK)
Of these areas, teams ranked highest in the slap shot goals metric. Furthermore, teams the Leafs beat ranked above league average in:
- Snap shots (PHI, EDM, BOS, BUF, FLA)
- Snap shot goals (BOS, PHI, EDM, FLA, VAN)
- Defensive zone face-off win percentages (BUF, BOS, EDM, VAN)
Even teams without elite scorers have adopted a strong puck possession system and bulletproof defense. These types of teams rank well above league average in shots on goal and blocked shots and these systems have gained popularity because they work. Marner’s success is incredibly dependent on the Leafs’ overall functionality and ability to maintain possession of the puck. Without puck possession, he’s not able to do his job, which is to score goals. Simply put, there’s something about teams who beat the Leafs that infringes upon Marner’s ability to do his job successfully.
Ice Time Impacts Marner’s Performance
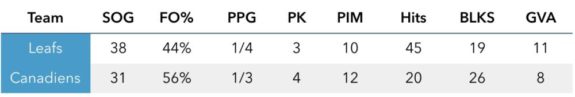
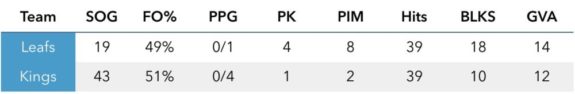
In Marner’s eighth game, his shifts were longest to date. In fact, of his 14 NHL games played, he’s had the most ice time and longest shifts when playing against the Los Angeles Kings and Montreal Canadiens, which were games the Leafs lost.
This is also interesting.
Marner’s average TOI per game is 16:40 and his average shift length is 47 seconds, yet in his game against the LA Kings, he played 18:01, with shifts 54 seconds in length. In his game against Montreal, he played 18:43, with shifts 51 seconds in length.
Playing 200-Feet of Ice
Players who can play a 200-foot game are extremely beneficial to teams in the NHL because they can play both ends of the rink. The game is obviously faster at the NHL-level than it is in Junior and for rookies making the transition, developing the wherewithal to keep up the pace both physically and mentally is a must.
TOI plays some sort of role in every rookie’s performance and with Marner, he produces points when playing fewer, shorter shifts. So why is he given more ice time and longer shifts in games lost? Perhaps it has something to do with his knack for scoring and perhaps Mike Babcock thought if Marner was given more opportunities to shoot on net, he would eventually get one in. However, it seems that Marner may actually be scoring less when he plays more, even though he’s still getting the same number of shots on goal. Furthermore, perhaps the reason Konecny still produces points regardless of the score is because he averages 15:27 in games won and 16:02 in games lost. That’s well below Marner’s average TOI.
Marner’s performance in these two games may also have been impacted by the Kings’ and Canadiens’ style-of-play. So I looked for commonalities between them and found they’re similar in the following areas:
- Number of penalty infraction minutes (PIM) incurred per game played (both teams delegate an average slightly above half of one period to someone sitting in the penalty box instead of playing hockey)
- Offensive zone face-off win percentage (roughly 50 percent each)
- Neutral zone face-off win percentage (roughly 50 percent each)
- Tipped goals (both teams score very few tipped-in goals)
- Tipped shots (both teams are tied for fifth last in league)
- Wrap around shots (both teams tied for fourth last in league)
- Slap shot goals (both teams rank high, especially Montreal)
- Snap shot goals (both teams rank in league average)
This tells us the Kings and Canadiens focus their goal-scoring efforts away from close proximity to the net. The Leafs are also vulnerable when the opposition takes slap shots on goal, especially since other teams the Leafs lost to also rank well above league average in this area. As seen in the list of strengths in teams the Leafs beat, though, they play well against teams who rank above league average in snap shots and snap shot goals.
If we compare simple stats from the Leafs’ two games against these teams, we’ll see the Kings had a surprisingly low number of penalties, especially considering their average PIM/GP is 10:36. In a previous analysis of the LA Kings’ style-of-play, high PIM is one of their biggest vulnerabilities. In their last seven games, however, they’ve only had one to four penalties each game, which is the longest streak they’ve had this season with this few penalties.
Leafs vs. Canadiens, October 29, 2016
Leafs vs. Kings, November 8, 2016
It’s no coincidence that Marner only scores goals in games the Leafs end up winning. There’s a reason for that and figuring out the problem is the first step to finding a solution. Konecny scores more goals when he gets more shots on goal, regardless of his team’s win/loss status. The Leafs are vulnerable when playing against teams who consistently have dangerous slap shots and slap shot goals, although they do spar well against teams ranking above league average in snap shot and snap shot goals. The Kings are vulnerable when they get penalties, especially when they get penalties while playing against the San Jose Sharks.
Advanced stats in hockey may be new to the industry and perhaps uncomforting, but there’s no denying the patterns they reveal about both players and teams alike.
Free Newsletter
Get Advanced Stats coverage delivered to your inbox
In-depth analysis, breaking news, and insider takes - free.
Subscribe Free →