We’re in the dog days of the NHL offseason. Thus, when former National Football League (NFL) wide receiver Chad Johnson praises Pavel Datsyuk, it becomes a major talking point in hockey spaces.
The ensuing discourse has resulted in takes ranging from “Datsyuk is underrated” to “Datsyuk is overrated.” In my eyes, the Detroit Red Wings center was worth the hype—and much, much more.
Below is a look at what made “The Magic Man” special, using analytics and game tape. To preface, the analytics era officially began in the 2007-08 season, but Datsyuk debuted in 2001-02 as a 23-year-old. So, plenty of his career isn’t included in that stretch—only his age 29-37 campaigns. With that aside, what made him special?
Datsyuk Was the King of Not Having Bad Games
Nicklas Lidström won four Stanley Cups and seven Norris Trophies across 20 seasons in Hockeytown. He was aptly nicknamed “The Perfect Human”—the legendary Swedish defenseman brought it every night. But I think Datsyuk deserves the same moniker. He was the king of not having bad games.
Expected Goals
To quantify this, let’s look at the playoffs, in particular. From 2008 to 2016, he appeared in 97 postseason contests. He had a positive 5-on-5 expected goal differential in 75 of those games, according to data from Evolving-Hockey.
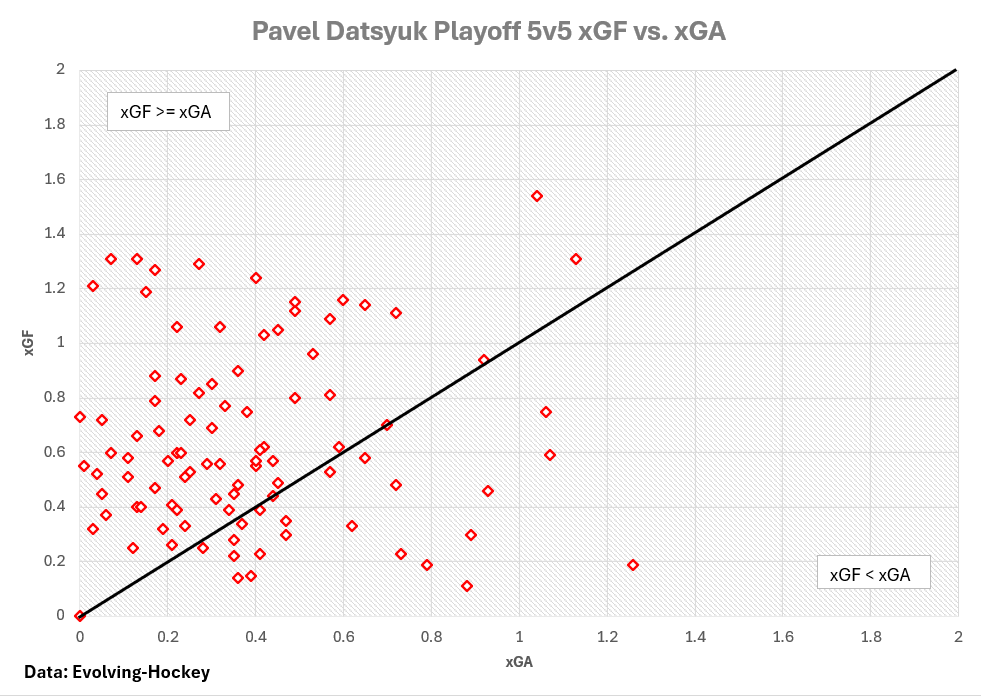
To put this in perspective, I compared Datsyuk’s percentage of positive expected goal differential games (77.3%) to other defining forwards of the analytics era. Nobody I looked at even reached 66%—not Aleksander Barkov, Patrice Bergeron, Sidney Crosby, Leon Draisaitl, Anže Kopitar, Nathan MacKinnon, Connor McDavid, or the half-dozen others.
I considered the idea that the Red Wings were simply too dominant, and that a bunch of his teammates were in his range. But Henrik Zetterberg, who arguably deserves to be in the Hall of Fame, finished with an elite—yet still distant—63.9%.
Datsyuk shone in the regular season, too, with 66.4% of his games having a positive expected goal differential. Bergeron beat him out, but the gap between them was smaller than that between Datsyuk and the next-closest player I looked at. That includes players from “shot-chucking” teams like the Carolina Hurricanes (taking a lot of shots can inflate expected goals).
Actual Goals
Now looking at actual goals, nothing really changes. Datsyuk’s regular-season share of positive goal-differential games saw a bump to 77.4%, but a similar increase can be seen with everyone. Bergeron’s number was just south of 80%.
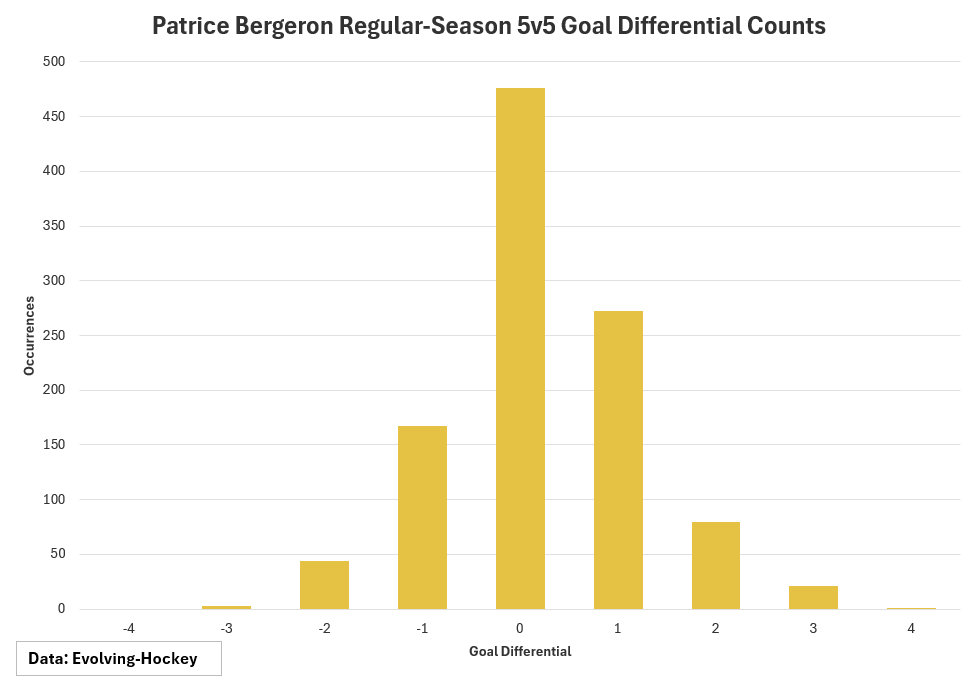
Even if Bergeron is a Hall of Fame-caliber player, the fact that he’s No. 1 in the statistic delegitimizes it a bit, no? Maybe, but there is one area where he sticks out: percentage of games with an even goal differential. Nearly 45% of his contests saw him deadlocked with his opponents.
Below is a chart showing his number of regular-season games with each 5-on-5 goal differential. He played in 1,064 total contests during the analytics era.
Here’s Datsyuk, by comparison, who played in 589 regular-season games during the analytics era. He had a much lower percentage of games with a goal differential of zero.
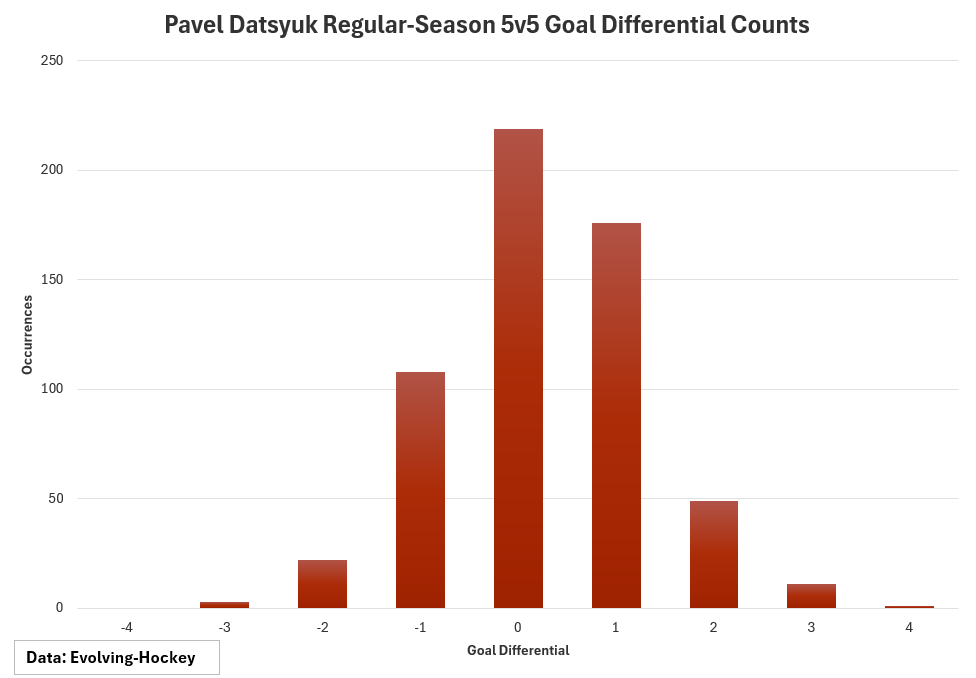
Let’s look at percentage of games with a non-zero positive goal differential (1-0, 2-0, 2-1, etc.) versus percentage of games with a negative goal differential. Bergeron finished his career with 35.2% in the former and 20.1% in the latter—a difference of 15.0 percentage points. Datsyuk, on the other hand, was at 40.2% and 22.6%, sporting a differential of 17.7 percentage points.
Now, does all of this really matter? Well, yes and no. McDavid’s differential was only 9.7 percentage points, so it clearly can’t matter that much. But it does tell us that Datsyuk outscored his opponents at 5-on-5 and rarely let them return the favor at a rate seemingly unmatched.
Considering the Longevity Factor
Despite the data we have only going back to Datsyuk’s 29-year-old season, it’s safe to assume that he didn’t necessarily defy the aging curve. Depending on the metric you use, his two best seasons of the analytics era came in 2007-08 and 2008-09, and his worst came in 2015-16. The only difference between him and normal players is that he was generational at his best and a superstar at his worst.
The eye test isn’t very efficient, especially from highlights alone, but his rookie-season tape suggests that he wasn’t much different from his agreed-upon prime when he was younger.
The first clip from the video below exemplifies that well. Datsyuk, whose career was only a few weeks old, got one of his patented offensive zone steals to set up a glorious scoring chance, but the recipient fumbled the puck. Upon gathering the puck behind the net, Datsyuk was met by All-Star defenseman Janne Niinimaa.
After getting danced for a good 10 seconds, Niinimaa stuck his leg out and tripped Datsyuk. No penalty was called, but the rookie got the puck back, dangled a bit, and helped set up a wide-open net for Boyd Devereaux.
I can’t say with absolute certainty that Datsyuk was better in his 20s than his 30s, but that wouldn’t be a wild assumption. Based on the available footage from that time in his career, there’s a case to be made.
Shifting gears to what we do know, when you adjust for age, Datsyuk’s impact on goal differential from 29 to 37 is unparalleled (this is a regularized adjusted plus/minus, or RAPM, statistic). The only forward with more than two seasons’ worth of playing time in the same conversation as him is reigning Hart Trophy winner Nikita Kucherov, and he’s only entering his age-33 campaign.
I’ve seen Datsyuk dinged for his offensive ability over the past couple of days, but I don’t think that’s warranted. His peak offensive RAPM was exceptional, and the best for his age. While he wasn’t a legendary point-getter per se, he also had two era-adjusted seasons eclipsing the century mark.
What Made Datsyuk Special: Looking at the Tape
If you’ve seen a Datsyuk highlight reel, you’re familiar with what he can do. Despite being one of the greatest defensive forwards in league history, he’s more known for his hands than his shutdown game. His passing, takeaway ability, and creativity were also all arguably the best of his era.
Game 6 of the 2008 Stanley Cup Final vs. the Pittsburgh Penguins wasn’t the most jaw-dropping performance of Datsyuk’s career, but it was probably the most important. According to Hockey Stats, his 5-on-5 xGF was 1.14, and his xGA was 0.04. In a 3-2 victory, he outscored Pittsburgh 1-0. Here are most of his puck touches.
Datsyuk recorded two assists, and only one bad thing happened with him on the ice: a penalty taken, which led to a goal against. In his defense, though, it was a fairly weak call considering how the game was being officiated, and I’ve seen him criticized for an alleged “lack of physicality” recently. He certainly didn’t lack physicality in that instance.
Elimination games in the Stanley Cup Final between opponents of that caliber can be tight, but Datsyuk didn’t seem too phased. While that wasn’t the most potent version of him on display, he was uniquely dangerous for the environment.
The Red Wings Weren’t the Same When Datsyuk Left
Here’s a not-so-fun piece of trivia: Datsyuk played 14 seasons in Detroit and made the playoffs every single time. Since he left, the Red Wings have not returned to the dance and today boast the NHL’s longest playoff drought.
The Red Wings were on the decline anyway, but Datsyuk was obviously vital to the team’s success. That’s reflected in Detroit’s numbers when he was on the ice versus off of it.
From 2007-08 to 2015-16, the Red Wings had a 60.7% goal share and a 57.2% expected goal share with Datsyuk on the ice during the regular season at 5-on-5. When he was off the ice, those numbers fell to 49.1% and 50.7%. The playoffs were even more dramatic: from 65.6% and 61.3% to 52.3% and 48.2%.
This is similar to the first section of this article in that these metrics (known as with-or-without-you, or WOWY) aren’t the end-all, be-all in terms of value to a team. A gap of that magnitude is remarkable, though, especially for actual goals—it was the highest I found among legends of the era.
Whether you admire a player who approaches the game like Datsyuk is a matter of opinion. But regardless of where you stand, you’ll be hard-pressed to find someone who played like No. 13 did.
Stats courtesy of Evolving-Hockey, Hockey Stats
Free Newsletter
Get Detroit Red Wings coverage delivered to your inbox
In-depth analysis, breaking news, and insider takes - free.
Subscribe Free →