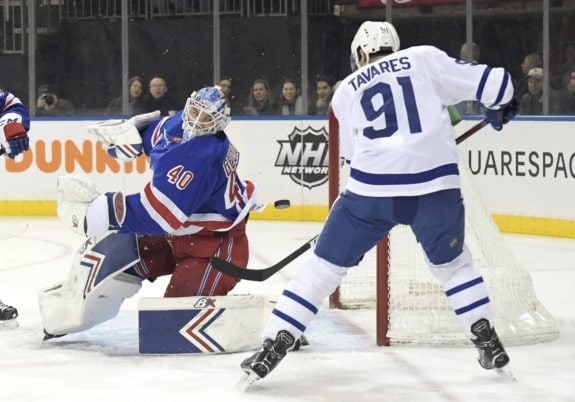
After 55 games this season, the Toronto Maple Leafs had a record of 34-18-3 (for 71 points). Exactly two-thirds through the season, the team was in third place in the Eastern Conference, one point behind the surprising New York Islanders (John Tavares’ old team), and a full 15 points behind the Tampa Bay Lightning.
Because the team is now entering its last third of the season, I thought this post would be a good time to review the team’s statistics to see what might be learned about where this team is and perhaps gain some insight about why it is so successful.
Statistic #1: Games Played
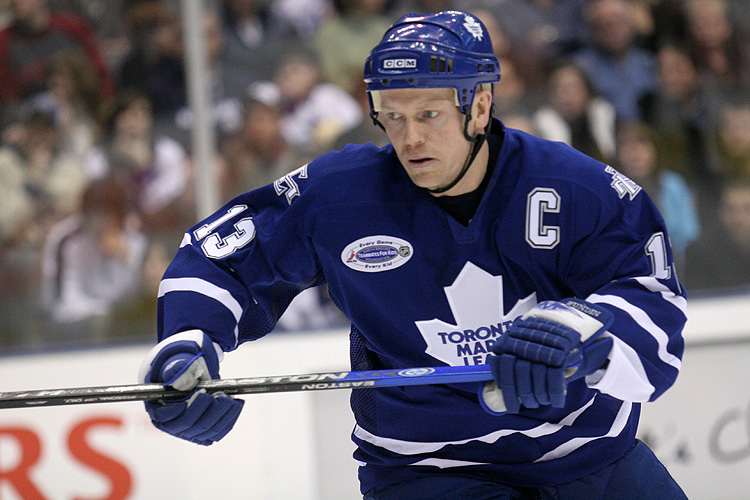
As noted, during the Maple Leafs first 55 games this season, 10 players played every game. These players were Mitch Marner, John Tavares, Morgan Rielly, Nazem Kadri, Kasperi Kapanen, Patrick Marleau, Connor Brown, Ron Hainsey, Par Lindholm and Nikita Zaitsev.
Of the players now on the active roster, obviously Jake Muzzin (six games) has played the fewest. Left-winger Trevor Moore has played seven games.
What’s interesting about reviewing games played is getting a sense of how injuries had impacted the team. Obviously, Auston Matthews’ injury was the team’s biggest hit, but other injuries also disrupted the team. Specifically, Andreas Johnsson’s concussion kept him out several games. Zach Hyman’s ankle injury was to blame for him missing games.
As well, injuries to Frederik Andersen and Tyler Ennis hurt the team. Andersen came back as strong as ever. But, personally, I’m sad to see Ennis gone for such a stretch. He’d become one of my favorite Maple Leafs players.
Statistic #2: Time on Ice
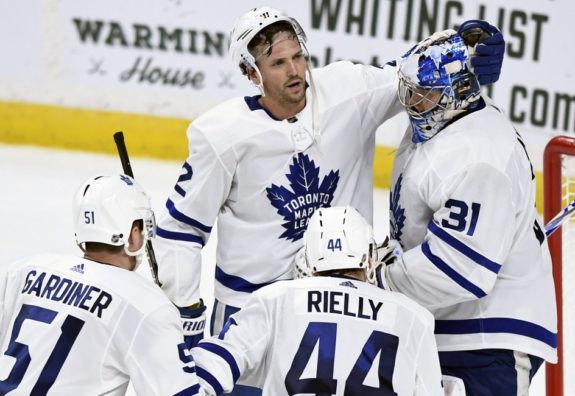
Not counting goalies, who (unless they are pulled) typically spend the entire game on the ice, the leaders in time on ice were defensemen Rielly (who averages 22:46), Jake Gardiner (21:25), Zaitsev (20:25) and Hainsey (20:00). Interestingly, among the forwards, Marner (19:39) and Tavares (19:05) had the highest average time on ice. Although there is perhaps no second-line center on the Maple Leafs because the top-two lines seem so interchangeable, Matthews (18:16) got about two minutes less ice time than Tavares. That might say something.
Typically, defensemen have an easier time logging more minutes because forwards lead the rush more than defensemen. Defensemen often do more gliding than sprinting. Forwards skate in faster bursts and also back check, while defensemen are typically already in position to defend an opponent’s rush. It can be the difference between a sprint and a distance race.
Statistic #3: Goals
Tavares, who is probably on his way to a career season, led the Maple Leafs with 33 goals. His previous season high was 2014-15, when he scored 38 goals and added 48 assists (86 points) with the Islanders. Tavares also has added 27 assists (for 60 points) this season. If he continues on this pace, he’ll beat his previous point total.
It’s interesting that Tavares has only one season in which he scored more goals than assists (the strike-shortened 2012-13 season, when the NHL played 48 games). That season, Tavares had 28 goals and 19 assists (47 points). No doubt, this season’s untypical scoring (more goals than assists) is partly because he’s playing with the ultra-talented Marner, who sees the ice as well as anyone.
Other goal scorers of note included Matthews (24 goals), Marner (20), Kapanen (16), Rielly (14) and Johnsson (14). In an aside, why there’s talk of trading either Kapanen or Johnsson makes no sense to me. Interestingly, of players who’ve played in every game, Lindholm (who plays 11:47 minutes per-game) had only one goal. For the 27-year-old rookie, who scored nearly a point-a-game in Sweden last season, it must be tough.
Statistic #4: Assists
Marner led the team with 46 assists in his 66 points. Rielly also had a large assist-to-goal differential with 14 goals in his 41 points. Tavares, as noted, had more goals that assists (33 goals, 27 assists). Perhaps the most interesting assist statistic is Gardiner’s, with only two goals to go with 25 assists. Gardiner, often touted as an offensive defenseman, has developed into more of a goal creator than a goal scorer. His career totals were 44 goals and 198 assists in 542 games. That’s quite a difference between goals and assists.
Matthews was the only other notable Maple Leaf with more goals than assists (24 goals and 23 assists).
Statistic #5: Plus/Minus (+/-)
Surprisingly, Hainsey was the plus/minus team leader at plus-27, with Rielly following at plus-24. A surprise to me is that Johnsson, at plus-19, was third on the team ahead of Marner, at plus-18. Even more of a surprise was that the much-maligned Gardiner carried a plus-17, ahead of Tavares’ plus-15. Of all the regulars on the roster, Marleau at minus-five and Nylander at minus-two were the only players with negative plus/minus statistics through 55 games.
Obviously, the Maple Leafs had more players with a positive plus/minus than a negative because their goal differential of 195 goals for and 157 goals against (plus-38 differential).
As a note, I have included plus/minus here because it’s still measured. That said, I recognize plus/minus is a contestable measurement, with some people noting it’s the worst hockey statistic ever, with a goalie’s save percentage a close second. Plus/minus is highly variable, and countless factors outside a player’s control influence it. As well, plus/minus statistics include all even strength goals, all goals with either goaltender pulled (the NHL views goalies pulled as even strength) and all shorthanded goals.
Statistic #6: Shots on Goal
It’s probably no surprise Tavares led the team with shots on goal with 199. Marner follows, but had 50-plus shots fewer (148 shots). And following, in order, all with more than 100 shots on goal, Rielly (145), Kadri (143), Matthews (131), Kanapen (118), and Marleau (108). On the mirror side of this statistic (with the fewest shots on goal), I was surprised to see Nylander (although he has only played 27 games) with only 48 shots on goal. That’s fewer than two shots-per-game. Somehow, I expected more shots from him.
Statistic #7: Game-Winning Goals
It’s little surprise Tavares had the most game-winning goals (six), because he has the most goals. Marner, Rielly, Matthews and Kadri all had four game-winners; Kapanen and Marleau had three. Perhaps what’s more surprising is that only two other active Maple Leafs had scored game-winning goals; Johnsson and Hyman each had two. I say still active with the team because Josh Leivo, since traded to the Vancouver Canucks, had two game-winners in limited action (27 games).
Statistic #8: Faceoff Wins, Losses & Percentages
Similar to other NHL teams, Maple Leafs centers take most of the faceoffs. Of these centers, Tavares led with 563 wins and 470 losses (54.50 percent). Matthews was second with a record of 298 wins and 270 losses (52.46 percent). Kadri had 293 wins and 252 losses (53.76 percent). Lindholm was fourth with 194 wins and 184 losses (51.32 percent) and Frederik Gauthier was fifth with 157 wins and 134 losses (53.95 percent).
Of wingers who also take faceoffs, Nylander, Hyman and Marleau had all won more faceoffs than they’ve lost. The statistics show the Maple Leafs to be a highly-efficient faceoff team, having won more than 50 percent of their faceoffs. Only the Philadelphia Flyers (at 56.0 percent) led the Maple Leafs (52.9 percent) in team faceoff statistics.
Statistics Don’t Tell It All
Obviously statistics don’t tell everything about players and teams, however a review of the Maple Leafs’ statistical record offers insight into the team’s play and, ultimately, the team’s success. For me, there were a number of surprises: for example, Hainsey atop the plus/minus and the team’s highly-successful faceoff percentage. Although I haven’t done a thorough review of the team’s goaltending statistics, perhaps that would be equally as revealing.
Free Newsletter
Get Toronto Maple Leafs coverage delivered to your inbox
In-depth analysis, breaking news, and insider takes - free.
Subscribe Free →