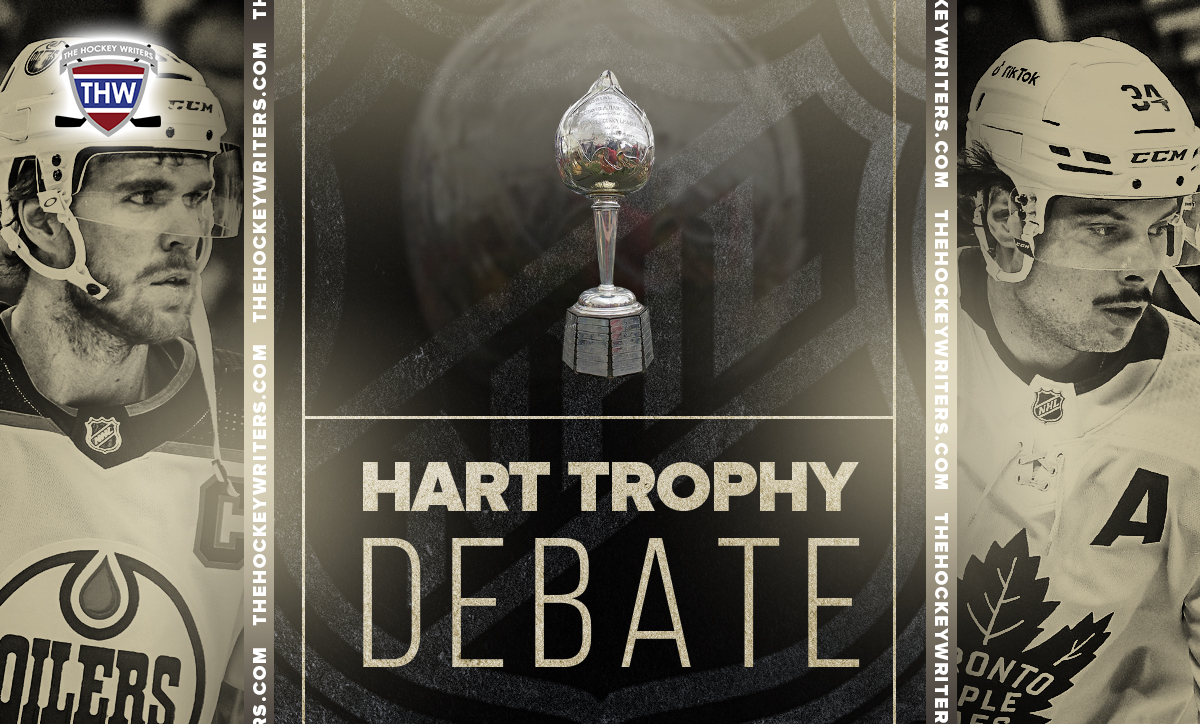
This will be an in-depth look at Connor McDavid and Auston Matthews as the expected leaders in the Hart Memorial Trophy race, with about 10 games remaining in the 2021-22 regular season. The Hart Trophy is given out to the NHL’s most valuable player. This award generally excludes players on teams who don’t make the playoffs since how valuable could the player really be that season to the team if they don’t finish in the top half of the league.
There could easily be an argument for the other side of things as well, considering hockey is a team game, and it takes much more than one player to make the playoffs. Take McDavid and the Edmonton Oilers, for example. In 2017-18, the Oilers missed the playoffs, and McDavid finished fifth in voting for the MVP to Taylor Hall, who recorded 15 fewer points. But because the New Jersey Devils just squeaked into the playoffs, Hall received 1264 votes to McDavid’s 270.
Both the Oilers and Toronto Maple Leafs are primed to make the playoffs this season, so that won’t be a swaying factor, but the rest of the team and the players around them may. Let’s first look at who each individual has to play with and the success they’ve had this season, which has a factor in the overall play of McDavid and Matthews.
Linemates’ Impact on McDavid & Matthews
We will start with the current lines both McDavid and Matthews play on, beginning with McDavid, the reigning Hart Trophy winner.
McDavid is on a line with Evander Kane and Jesse Puljujarvi. Once again, he’s had somewhat of a carousel of wingers this season due to injuries to players like Kailer Yamamoto and Zach Hyman. As a line, the three have played just over 100 minutes together at five-on-five and have outscored opponents 7-1. They have an expected goals for percentage (xGF%) of 57.31, while the team has an xGF% of 46.81 when none of them are on the ice. The on-ice shooting percentage of the line is 8.54.
To compare to the Matthews, Mitch Marner, and Michael Bunting line, they have 519 minutes together at five-on-five. They have a 65.03 xGF%, while the team has a 51.45 xGF% when all of these players are off the ice. They have a chance to be the best top line in Maple Leafs’ history.
The key factor that makes Matthews’ line stand out is that he has Marner beside him, while McDavid doesn’t play with a player of that quality. Without Marner, Matthews, Bunting, and the replacement winger’s xGF% drops to 60.51 from 65.03. It goes down even further when you look at Matthews without Bunting to 59.05 percent.

McDavid’s linemates don’t have nearly the same impact as Matthews’ linemates. McDavid and Puljujarvi without Kane see their xGF% rise to 62.56 from 57.31, while McDavid and Kane without Puljujarvi have a 54.41 xGF%. McDavid’s xGF% without either of his current linemates is 56.93. But remember, the Maple Leafs’ remaining players combine for almost 5.00 xGF% higher than the Oilers.
It has been clear that even though Puljujarvi has had a positive impact defensively and forechecking, finishing has been hard to come by, especially in the loss to the Colorado Avalanche, where he had two open chances on two different 2-1 plays being fed by McDavid. Puljujarvi has just an 8.8 shooting percentage (SH%) this season playing 550 minutes with McDavid, while Marner has a 15.8 SH% and Bunting has a 12.9. Linemates make a huge difference, and they should be taken into account.
McDavid & Matthews’ Individual Analytics
To not many people’s surprise, McDavid leads the NHL in individual expected goals with 39.4, followed closely by Matthews, who is tied in second with Draisaitl with 38.1.
McDavid’s xGF is 74.9 in all situations, while his xGA (expected goals against) is 56.9. Matthews’ stats in this department are 65.4 xGF and 40.3 xGA, respectively.

The formula for goals created is (Goals + Assists x 0.5) x teamGoals / (teamGoals + teamAssists x 0.5). This covers a number of bases but still has its flaws, not taking into account primary assists, for example. Matthews has 42 goals created at a rate of 0.63 per game, while McDavid has 40 goals created at 0.56 goals created per game.
Looking at point shares, you can split them into two categories: offensive and defensive. These are based on an estimate of how many points the player has contributed based on his offence and defence. Matthews has contributed 11.4 points based on his offence and 1.9 based on his defensive game, totaling 13.3. McDavid has contributed 10.1 offensively and 2.4 defensively for a total of 12.5.
Now we will look at the Corsi and Fenwick of both players. The difference between the two is Corsi takes into account shots, misses, and blocked shots while Fenwick only takes into account shots and misses. This is generally used to see which team controls the puck more while that individual is on the ice. Matthews has a 64.1 Corsi for percentage (CF%) and 63.9 Fenwick percentage (FF%). McDavid currently has a 62.6 CF% and a 62.1 FF%.
Looking a bit more at some overlooked stats that affect play in the defensive zone as well are hits, blocked shots, takeaways, giveaways, and faceoff percentage. McDavid has 67 hits to Matthews’ 58, but Matthews has the advantage elsewhere. He has 53 blocked shots, 82 takeaways, 45 giveaways, and a faceoff percentage of 56.3, which is 18th in the NHL (from ‘Auston Matthews leads Richard race; what are his Hart, Selke chances?’, NBC Sports, April 9, 2022).
McDavid, on the other hand, has just 24 blocked shots, 60 takeaways, 65 giveaways, and a faceoff percentage of 53.8. Take into account the amount of time that McDavid has the puck on his stick more than Matthews and how it is counted as a giveaway when a pass is turned over. McDavid makes a lot more passes than Matthews. Taking this into consideration, McDavid has 16 defensive zone giveaways, while Matthews has 17.
Matthews starts more plays in the offensive zone than McDavid, giving him a better chance at creating offence immediately. Matthews starts 20.6 percent of plays off of an offensive zone draw, while only 8.4 percent in the defensive zone. McDavid starts 18.8 in the offensive zone compared to 9.7 in his own end.
Both the Maple Leafs and the Oilers’ power plays are top-four in the NHL this season, both over 25 percent. That means power plays can often give them an advantage in the game. Let’s look at the penalties taken by each player and penalties drawn. McDavid is miles ahead here with 98 penalty minutes drawn and 31 taken for a differential of 67. Matthews has only drawn 18 minutes worth of penalties while taking 14 minutes. A big factor is the officiating, and I believe each player should have drawn a ton more penalties at this point in the season.
To sum up, McDavid has the edge in expected goals, xGF, defensive point shares, goals against, hits, defensive zone giveaways, zone starts, penalty minutes drawn, and penalty minutes differential.
Matthews has the edge in xGA, goals created, offensive and total point shares, Corsi and Fenwick, blocked shots, takeaways, giveaways, and faceoff percentage.
I’d look at that as just about dead even, but some of those are more meaningful than others.
Stats accumulated from Natural Stat Trick, Money Puck, & Hockey Reference.
Feats & Accomplishments in 2021-22
Starting with the basic stats and what most people will lean towards, McDavid has played 72 games, scored 42 goals (a career-high), 66 assists, and 108 points. The 42 goals place him fifth in the league today, while assists have him in fourth, and he has the most points in the NHL by four over the next closest player.
Matthews has played 67 games and has 58 goals, 41 assists, and 99 points. He leads the league in goals by eight and is tied with the fifth-most points in the NHL.
This is a battle between the most dynamic goal-scorer in the game and the best dual-threat in the league while also arguably being the best playmaker as well. McDavid has as many primary assists as Matthews has total assists this season. Both players are tied with nine game-winning goals each, while McDavid is the only player in the NHL with four overtime winners. Matthews has two.
Now for the fun part as both of these players have hit a ton of milestones this season. McDavid and Matthews are both generational talents, and we haven’t seen a battle like this since Sidney Crosby and Alexander Ovechkin in their primes.
Connor McDavid
- McDavid reached 100 points in a season in the fifth-fewest games since 2010-11 (67 GP).
- Seventh player in NHL history to record multiple 15-plus game point streaks in one season.
- Recorded two multi-point streaks of at least five games this season, accounting for 26 points in 11 games.
- Leads the league with 40 multi-point games.
Auston Matthews
- Matthews is the first player to score 50 goals in a 50-game span during a season since Mario Lemieux (1995-96).
- Matthews has scored 71 goals in the past 82 regular-season games played.
- Set a franchise record for goals in a season when he scored his 55th goal of the season. He has continued to extend that.
- Most goals by an American-born player in NHL history in a season, passing Kevin Stevens and Jimmy Carson.
- Matthews has scored four hat tricks this season, previously scoring three in his first five combined seasons.
- Has recorded three six-plus goal streaks this season, accumulating 27 goals in those 19 games.
- First player to reach 50 goals in a season in 62 games or fewer since 1995-96.
- Only one centre since 1990 has required fewer games to score 45 goals in a season (56 GP) than Matthews, Mario Lemieux (41 GP in 1995-96 & 46 GP in 1992-93).
Though the Oilers franchise has much harder numbers to reach since the best player to play the game, Wayne Gretzky, played for them, McDavid set a lot fewer franchise marks than Matthews. Many of McDavid’s accomplishments have been in regards to his career and reaching milestones at such a young age.
Considering the impact of their teammates and linemates, individual analytics, and their accomplishments this season, I would give the slight edge to Matthews as of right now. His goals are a huge factor in this debate, especially if he can hit 65. If McDavid reaches 50 goals this season which is within reach, the conversation will become closer. McDavid will also have to increase the distance between him and the next player in terms of points.
There is still time to change the narrative, and many may not agree with me anyways. I’m not the one doing the voting, but the trophy voters have been questionable with some decisions they’ve made. Let me know in the comments who deserves the Hart Trophy between these two players as of right now.
Free Newsletter
Get Advanced Stats coverage delivered to your inbox
In-depth analysis, breaking news, and insider takes - free.
Subscribe Free →