Ben Chiarot has settled in quite nicely on the Montreal Canadiens blue line since he was acquired by Marc Bergevin in the summer. He has received accolades from across the hockey world and has undoubtedly changed the minds of some non-believers.
He brings a big body and physical presence to the Canadiens; easily seen on his shifts. At a time when big hits have fallen out of fashion, Chiarot has managed to walk the fine line of providing quality hockey and physical play; not an easy thing to achieve in today’s NHL.

But does the eye test pass the analytics test? Let’s dive into the numbers.
Julien’s Most Used Five-on-Five Defender
First, I always look at ice time played per game, because it’s the basic indicator of a coach’s trust. At over 21 minutes, Chiarot ranks third in TOI among Canadiens’ defencemen, behind Jeff Petry and Shea Weber. This puts him solidly in the category of top-four defenceman.
He plays the most at five-on-five (over 18 minutes per game) of any Canadiens defender, and is used as one of the primary penalty killing defencemen along with Weber and Petry.
Although Chiarot shows offensive flare, he does not play on the power play.
What Advanced Statistics Tell Us About Chiarot
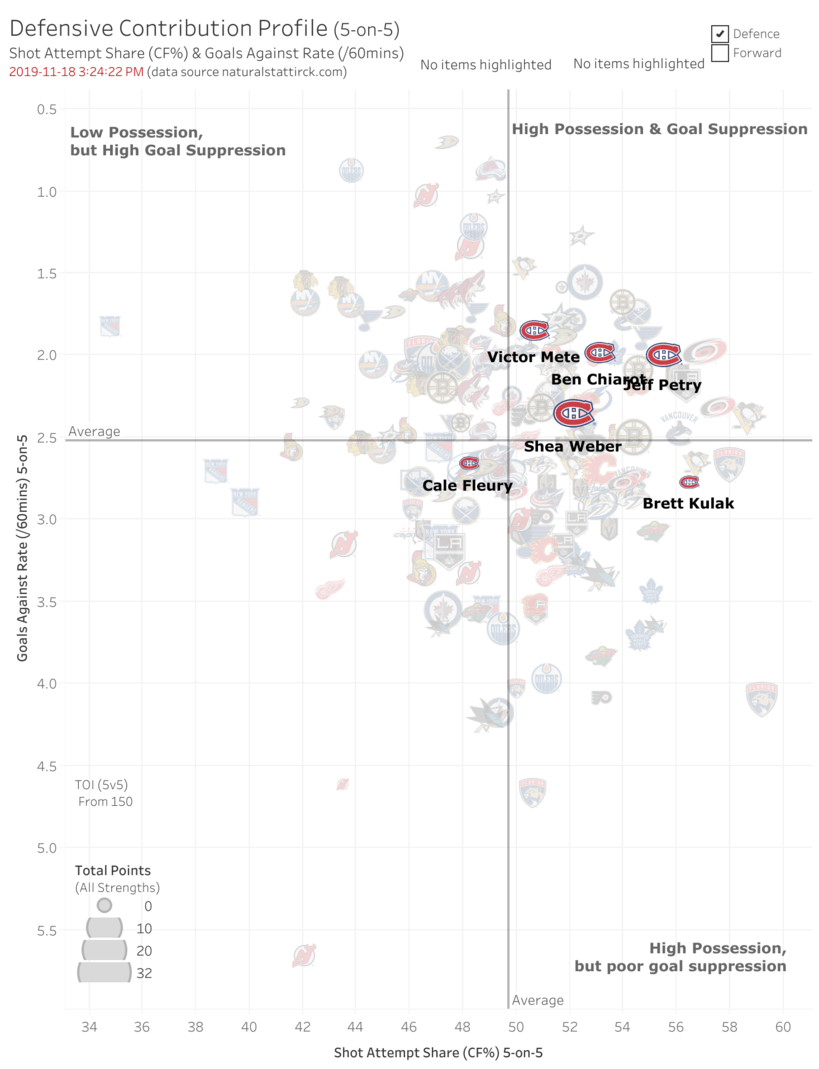
A closer look at the advanced statistics indicates that Chiarot has played a very strong five-on-five game compared to the rest of his NHL peers. The chart below shows Chiarot in the top right quadrant. While the defencemen in this quadrant are on the ice, their teams enjoy strong possession (measured by a high share of shot attempts) and a low goals against rate.
When Chiarot is on the ice, the Canadiens enjoy over 53% of the shot attempts share and a very low 1.98 goals against rate (per 60 mins). It’s easy to see on this graphic that most of the Canadiens’ defencemen are in good company.
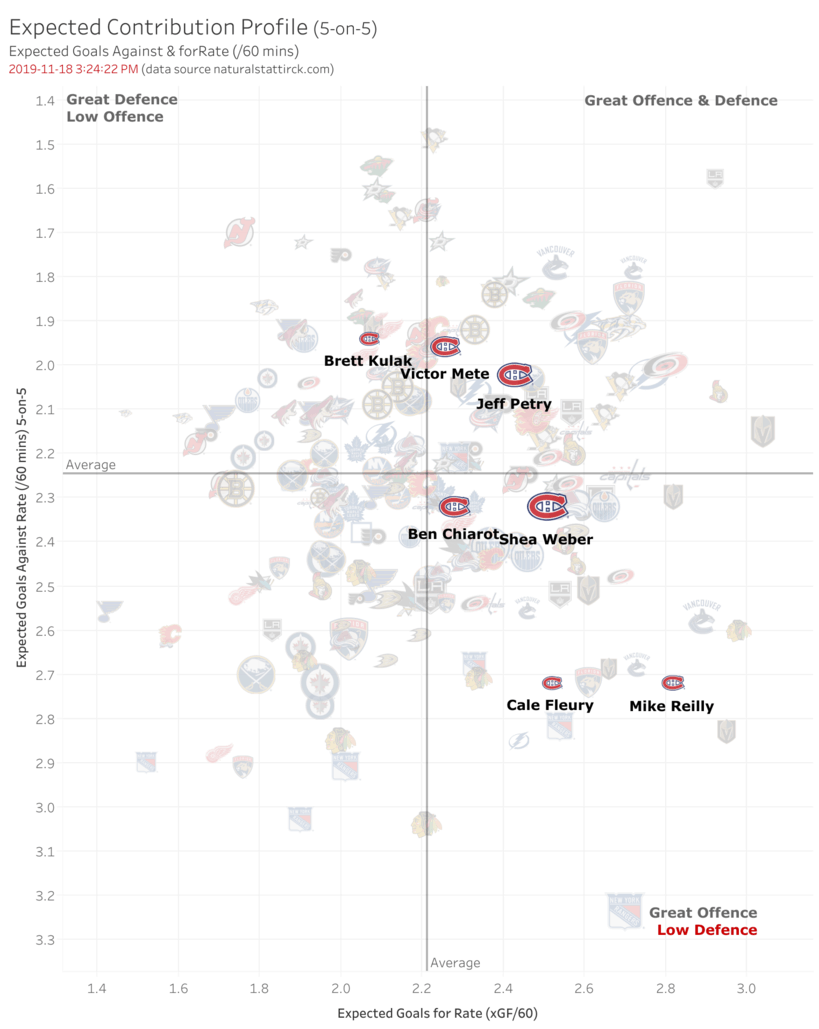
But, it’s always difficult to isolate one player in a team sport to measure their impact, especially hockey with so many variables and influences from other factors such as a strong forward line or an elite goalie. We can attempt to remove some of those influences by measuring expected goals; a metric that takes into account many factors including shot quality.
The chart above shows expected goals for and against. Defencemen in the top right quadrant, the great offence and defence quadrant, provide their team with both high-end offence and defence. Using this model, Chiarot remains above average on the offensive side, but falls just below the average line on expected defence (expected goals against). This expected goals model implies that his good defensive numbers may be padded by his goaltender.
Chiarot Is Trending Up
So far, acquiring Chiarot has been a big win for the Canadiens. Based on last season’s numbers, the former Winnipeg Jets defenceman has improved on all important facets of the game this season.

As highlighted in green in the chart above, Chiarot has seen an increase in ice time per game by almost two mins. His possession numbers are way up from 47.51% of shot attempts (CF%) to 53.13%. Both his goals for and expected goals for shares are up dramatically. It’s also interesting to note that his on-ice five-on-five save percentage (93.72%) is similar to last season (94.64%), and that his usage is more difficult this season, with his offensive zone starts (51.04%) down from last season (55.17%).
More to Come from Canadiens’ Big Defenceman
When you consider that Chiarot has had to adjust to new teammates, a new system, as well as a plethora of off-ice changes, he has acquitted himself nicely. Based on this analysis and the steady increase in confidence we’ve seen on the ice, we may see a lot more from the Canadiens’ big defenceman as the season progresses.
All statistics used in this article are courtesy of naturalstattrick.com.

