The emergence of advanced stats have truly altered the way in which the game of hockey is perceived.
Long gone are the days in which players were evaluated strictly by the number of goals they scored and points they accumulated. So too are the basic stats used to interpret a given teams overall performance, in particular information such as goals for and goals against.
In the modern day hockey world, a new breed of analytical statistics has taken over, and it is one which has become not only highly complicated, but at times downright confusing for the mere mortals attempting to understand them.
New methods of statistical analysis are based largely on the situational play of both individual players and their teams, providing insight into the strengths and weaknesses of players and their clubs in the various moments of a hockey game.
However, despite the widespread application of advanced stats in the game today, it has been a relatively short period of time since such statistics have been implemented.
In fact, it has been largely over the last five years in which such analysis has come to play such a major role in decision making throughout the League.
With that being said, let’s take a quick look at five incredibly interesting and simply surprising advanced stats from the past five years of NHL play:
-
The Puck Stops Here
Despite their poor record over the past few years, it will come as a shock to many to learn that the Arizona Coyotes have the fourth best Team Save Percentage (SVP%) since the 2010-11 season in five on five play.
Although they have missed the playoffs three times in the past five years, the Coyotes’ SVP% in that time period is an impressive .927, a number which is greater than a number of teams known for their spectacular goaltending, namely the Los Angeles Kings (.926%), Nashville Predators (.924) and Detroit Red Wings (.923).
At fourth place, the Coyotes trail only the Boston Bruins, New York Rangers and Montreal Canadiens in SVP%, who hold .933%, .929% and .928% team Save Percentages, respectively.
-
Corsi Champions
Corsi, developed by St. Louis Blues goaltending coach Jim Corsi, is a statistic which essentially measures puck possession and offensive chances produced as a result. Specifically, Corsi is calculated as follows:
(Shots For + Missed Shots For + Blocked Shots Against) – (Shots Against + Missed Shots Against + Blocked Shots For)

As mentioned, this statistic essentially refers to the number of offensive opportunities generated by a given player or team. As a result, a higher Corsi represents a higher number of scoring chances produced. One subset of Corsi is Corsi For, or CF%, which measures the percentage of Shot opportunities For relative to all shot chances.
Like Corsi, a higher CF% indicates a greater number of offensive chances. For example, if a team has a CF% of 60%, it means that for every six shots either on net, blocked or missed produced, four were allowed against.
Over the past five seasons, there has become a distinct correlation between CF% and the success of NHL teams.
In fact, since 2010-11, the three teams to win the Stanley Cup are all within the top five in Team CF%. The Los Angeles Kings are first over the past five years with a CF% of 54.8%, the Chicago Blackhawks second at 53.7%, and the Boston Bruins fourth at 52.7%.
Resulting from this five-year trend, it is clear to see that a higher CF% is present in the NHL’s most successful teams, indicating success is dependent on dominant puck possession and the resulting higher percentage of scoring chances.
-
Kings of Corsi
On the topic of Corsi, and more particularly CF%, we once again find ourselves talking about the Kings.
In looking at advanced stats from the period of 2010-15, not only did the Kings retain the top CF% as a team, but also the top four players in individual CF% during five on five play. Jake Muzzin produced the highest CF% in the NHL since 2010 at an amazing 59.8%, an incredible percentage given any rating above 55 is considered by most as elite.
Moreover, the Kings were also very fortunate to feature Justin Williams, Anze Kopitar and Tyler Toffoli during this five year span, whose CF% were also incredibly high at 59.1%, 58.5% and 58.2%, respectively. As a result, it is increasingly clear as to why the Kings have enjoyed such incredible success over the past five seasons.
-
Cold Blooded
Every NHL team covets a minute-eating, consistent and big bodied defender, and fortunately for the Minnesota Wild, they have exactly that player in Ryan Suter.
Known for his tireless work ethic and seemingly endless energy on the ice, Suter is known for both his willingness, and ability, to play upwards of 30 minutes of ice time in a given game, if required. In fact, over the past five seasons, Suter has played the greatest Percentage of Team Time On Ice (%ofTeamTOI) in the NHL, in all situations.
With a %ofTeamTOI of 45.26%, Suter has played a huge percentage of his teams total ice time in the past five years, logging nearly 10,000 minutes of ice time, a total which is nearly 300 minutes greater than Drew Doughty of the Los Angeles Kings, who ranks second with a %0fTeamTOI of 43.24%.
-
Primary Player
When discussion arises regarding the NHL’s best offensive player, people tend to immediately think of names such as Sidney Crosby, Claude Giroux, Steven Stamkos and John Tavares, the list goes on. Yet when discussing Alex Ovechkin, many are quick to dismiss him as a one dimensional player, whose game is based strictly on goal scoring.
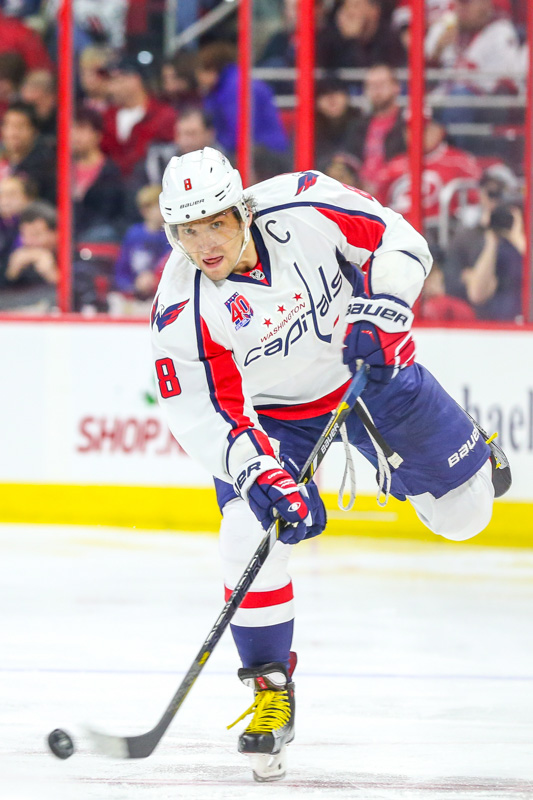
However, one amazing statistic which should definitely alter the perception of Ovechkin is the fact that he has led the NHL in Individual Primary Points since the 2010 season.
Individual Primary Points, or iPPoints, measures the number of points recorded by a select player in which he either scored the goal, or received the primary assist on the play. Over the past five years, Ovechkin ranks first in the League with 300 iPPoints in 363 games.
Conversely, Stamkos has produced 298, Tavares 272 and Giroux 258, while Crosby has scored just 249 iPPoints, although he has missed time due to injury.
Regardless, it is clear that Ovechkin is a multi-dimensional player, and has undoubtedly been the NHL’s most skilled offensive player over the past five years.
Have interesting Advanced Stats you would like to share? Comment below!
* All statistics courtesy of Puckalytics.com
Free Newsletter
Get Advanced Stats coverage delivered to your inbox
In-depth analysis, breaking news, and insider takes - free.
Subscribe Free →