- How I Approached This Exercise
- Additional Information
- The Results
- The Worst Team Is…
- In the 30th Spot, the Buffalo Sabres
- The Next Five: Old or Rebuilding, Young or Disappointing, and the Colorado Avalanche
- Teams 24-20: The Montreal Canadiens, One Playoff Team, and Three Within Three Points of a Playoff Spot
- 19. The Aging Former Champions – Detroit Red Wings – 300.5
- 18. The Most Interesting Team – Vegas Golden Knights – 310.8
- Teams 17 and 16: Both Disappointing Teams this Season
- Teams 15-11: One on the Way Up, One on the Way Down, Two Stagnant Teams, and the Champs
- 10. All Offense, No Goaltending – New York Islanders – 345.3
- 9. The Playoff Surprise – New Jersey Devils – 346.3
- 8. The Up-and-Comers – Toronto Maple Leafs – 347.3
- 7. The Old but Still Contending – San Jose Sharks – 352.5
- 6. Lacking in Elite Scorers but Well-Balanced – Nashville Predators – 352.5
- 5. The Biggest Surprise – Columbus Blue Jackets – 353.5
- 4. A Lethal Offense – Winnipeg Jets – 370.0
- 3. The Steady Veterans – Boston Bruins – 376.8
- 2. High-End and Balanced Scoring – Tampa Bay Lightning – 386.0
- 1. The Best Peak Roster is the Anaheim Ducks – 398.3
- The Wrap-up
- General Takeaways of Peak Performances
- Surprises
In March, ESPN published an article, “Which team would be MLB’s best if every player were in his prime?” The writers went through each MLB franchise, took every team’s roster and determined each player’s peak season using Wins Above Replacement (WAR). They picked one player from each position and ensured that each team had 13 hitters and 12 pitchers. Then they added up each player’s WAR to generate the team’s total and compared each team to determine which one had the highest peak.
The fun part about such an exercise is that it incorporates players whose peaks would have been on different teams and in different years. I love looking at rosters and how they are structured and wanted to apply the idea of peak performance to NHL rosters.
I wanted to know which teams have players with the highest individual ceilings and whether the teams with the highest peaks are comparable to the best teams for the 2017-18 season. Additionally, I was curious what leads to a team’s peak—a couple of players with MVP-caliber seasons or a roster filled with players who all peaked around 50 points.
How I Approached This Exercise
The first step was to come up with a way to compare players across the different positions that didn’t place more weight on a player’s value than he deserved. In baseball, the presence of WAR is great because it looks at an individual’s production, both offensively and defensively, and compares it to an average player’s production at the same position. Hockey, on the other hand, does not yet have such a stat.
Instead, the closest thing developed for hockey has been point share, which calculates the number of team points an individual player is responsible for in a given season. It is a good stat to use because it can be used to value both skaters and goaltenders. Otherwise, we are left with trying to compare goals and points for skaters with save percentage (SV%) and wins for goaltenders.
One problem with point share is that it can overvalue an elite player on a relatively mediocre roster like Taylor Hall on the New Jersey Devils, where he had a 5.8-point share lead over second place. The other issue with point share is that it tends to place a large emphasis on goaltenders, which makes sense given the importance consistent goaltending has on the success of a season.

So, with point share a no-go, I moved on to other categories including expected shooting and save percentages. Both categories work well but would have required me to convert the expected shooting percentages into expected goals, and it seemed like more work than I wanted to get involved with.
What I ultimately went with was establishing my own rate for stats. For skaters, I decided to give a quarter-point for each goal and point in a player’s peak season for each category. For some players, peak goals and points were in the same season while for others they were in different ones.
For goaltenders, it took a little more work. I decided to only look at seasons in which a goalie made at least 20 starts. This was enough starts that it provided a large enough sample size but still a low enough total that backups could reach the threshold in a season.
So in a goaltender’s best season making at least 20 starts, I gave a quarter-point for each win and found his highest SV%. With that in mind, I found the league average SV% for that season, calculated the difference and multiplied that difference by a half-point. For example, if a goaltender had a .920 SV% in 2017-18 when the league average was .912, he would receive four points.

Here are a couple of examples of players not in the league anymore. Recent Hockey-Hall-of-Fame inductee Paul Kariya’s best season both in goals and points was in 1995-96 when he had 50 goals and 108 points. For his goals, he receives 12.5 and he gets 27.0 for his points, giving him a total peak performance score of 39.5.
For a goaltender, I’ll use Patrick Roy and his career-high .925 SV% in 2001-02. That season, the league average was .908, for a difference of 17 and 8.5 points. His highest win total came the season before with 40, which gives him 10 points and a total of 18.5.
Additional Information
NHL teams can have a maximum roster size of 23 players including two goaltenders. When evaluating teams, I adhered to league roster size using Roster Resource for roster information at season’s end. If a team had more than 23 players, I calculated each player’s peak season and then took away the players with the lowest scores until I reached two goalies and 21 skaters.
If a team only had one goaltender with at least 20 starts in a season, I did not give them an additional skater but kept their roster size at 22. I didn’t include any players on long-term injured reserve like Marian Hossa, David Clarkson, or Nathan Horton. Those players didn’t play in 2017-18 and therefore didn’t contribute to their teams. Again, I used end-of-season rosters, so even though the Sedins retired, they still played through game 82 and were incorporated.
The Results
The Worst Team Is…
The Arizona Coyotes had the lowest peak performance score at 248.5 and it wasn’t particularly close. They had one player with a score of at least 20.0, rookie Clayton Keller with 22.0. Their second- and third-highest scores were Derek Stepan with 19.8 and defenseman Oliver Ekman-Larsson with 19.5. Goaltender Antti Raanta only had a score of 14.3 after posting a .930 SV% this season but only winning 21 games, both career highs.
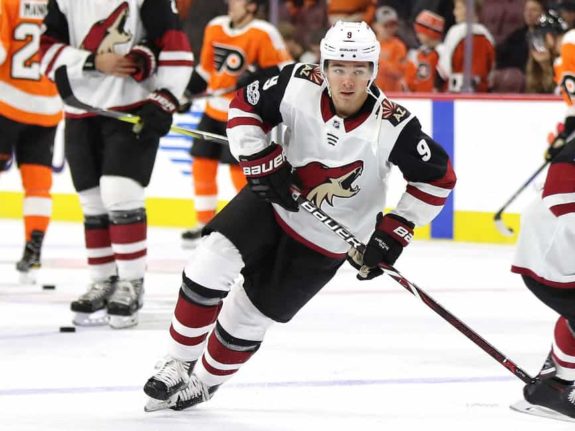
It makes sense why the Coyotes had the lowest total. They don’t have a defenseman with a top-five Norris Trophy finish and none of their players have received an MVP vote. They were the third-worst team this season and missed the playoffs by 25 points. Outside of Keller and Jacob Chychrun, they don’t have exciting young players and graduated several of their prospects this season. They also don’t have anyone who has ever scored 30 goals or had 70 points in a season.
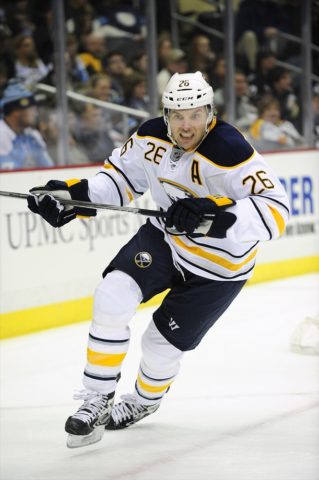
In the 30th Spot, the Buffalo Sabres
The Buffalo Sabres, with 254.8 points, are just a bit better than the Coyotes but have more players who have made significant impacts. Jack Eichel, Jason Pominville, Kyle Okposo, and Ryan O’Reilly all have scores of at least 20.0. Pominville leads the way with 28.5 for his 34-goal campaign in 2006-07 and the 80 points he scored the next season. The Sabres also have Eichel, who is leaps and bounds better than any of the young talent in Arizona.
Where the Sabres fall short is at the blue line and in net. Zach Bogosian and Rasmus Ristolainen are the only defensemen who have accumulated scores of at least 10.0 for their peaks. At goalie, neither Robin Lehner nor Chad Johnson have put together elite seasons in their careers. The Sabres also lack forward depth with five of them peaking at less than 10.0. Finally, onto some good news. Three of Buffalo’s 12 forwards set a career high in either goals or points this season.

The Next Five: Old or Rebuilding, Young or Disappointing, and the Colorado Avalanche
29. New York Rangers – 286.5 points (top peaks: Mats Zuccarello – 21.8, Chris Kreider – 20.3, Henrik Lundqvist – 17.8)
28. Carolina Hurricanes – 287.3 (top peaks: Justin Williams – 27.3, Jeff Skinner – 25.0, Cam Ward – 14.8)
27. Colorado Avalanche – 288.8 (top peaks: Nathan MacKinnon – 34.0, Mikko Rantanen – 28.3, Semyon Varlamov – 16.8)
26. Edmonton Oilers – 288.8 (top peaks: Connor McDavid – 37.3, Mike Cammalleri – 30.3, Cam Talbot – 16.0)
25. Chicago Blackhawks – 290.3 (top peaks: Patrick Kane – 38.0, Patrick Sharp – 28.5, Corey Crawford – 17.3)
Teams 24-20: The Montreal Canadiens, One Playoff Team, and Three Within Three Points of a Playoff Spot
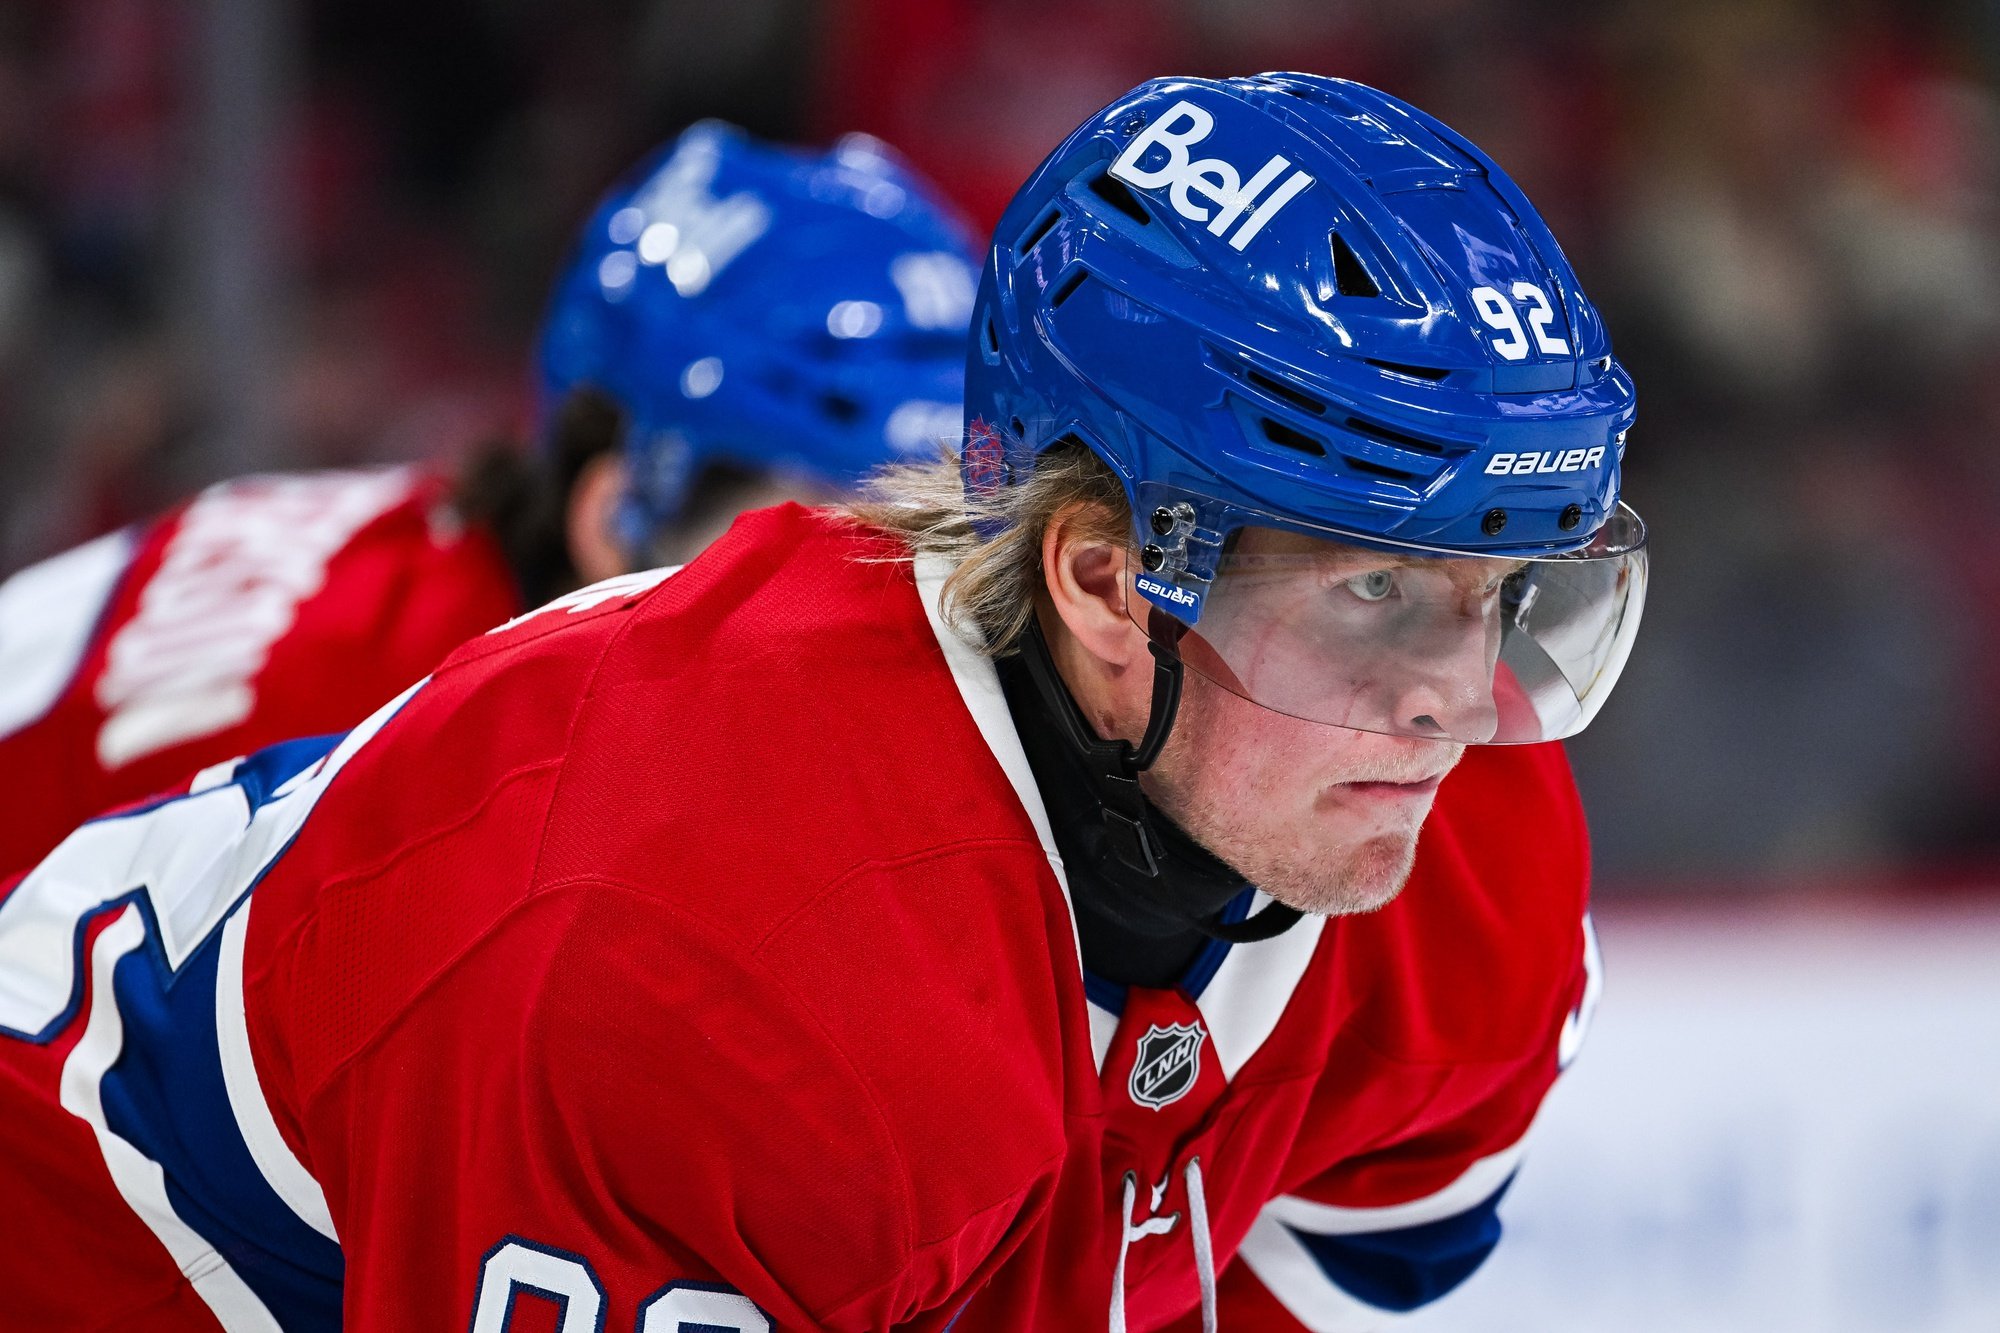
24. Montreal Canadiens – 295.0 (top peaks: Max Pacioretty – 26.5, Ales Hemsky – 25.0, Carey Price – 20.0)
23. Florida Panthers – 295.0 (top peaks: Aleksander Barkov, 26.5, Vincent Trocheck – 26.5, Roberto Luongo – 21.8)
22. St. Louis Blues – 297.3 (top peaks: Vladimir Tarasenko – 28.8, Brayden Schenn – 24.5, Carter Hutton – 14.5)
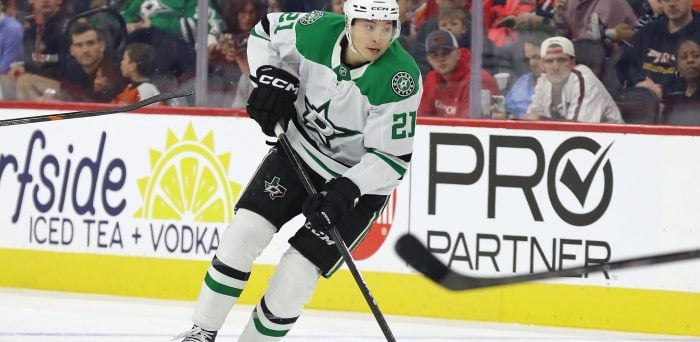
21. Dallas Stars – 298.3 (top peaks: Jamie Benn – 32.5, Jason Spezza – 31.5, Ben Bishop – 15.5)
20. Los Angeles Kings – 298.8 (top peaks: Jeff Carter – 32.5, Anze Kopitar – 31.8, Jonathan Quick – 17.5)
19. The Aging Former Champions – Detroit Red Wings – 300.5
The Red Wings have now missed the playoffs in consecutive seasons for the first time since the 1981-82 and 1982-83 seasons. They had the oldest roster in the league this season by nearly a full year and 10 of their players at season’s end were at least 30. They still have Henrik Zetterberg and Niklas Kronwall who were both on the 2007-08 and 2008-09 teams that reached back-to-back Stanley Cup Finals.
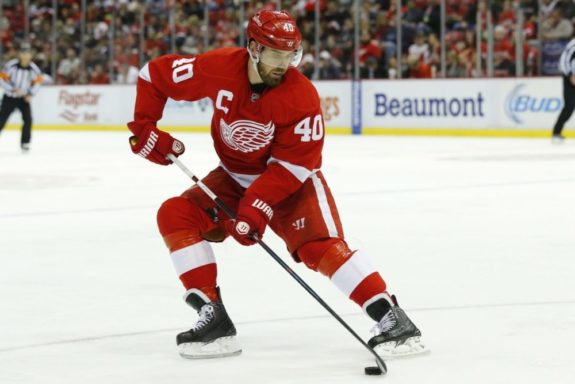
As a result, Zetterberg paces the team in peak performance score at 33.8 for his 2007-08 season when he had 43 goals and 92 points. Defenseman Mike Green, also older than 30, is their second-highest performer at 26.8 for his 2008-09 and 2009-10 seasons when he was with the Washington Capitals and had 31 goals and 76 points, respectively. In net, Jimmy Howard was the only Red Wing with enough starts to qualify and scored 16.3. In 2016-17, he had a .927 SV% and in 2009-10 he had 37 wins.
Detroit does have some quality young players who should lead the franchise when Zetterberg and Kronwall retire. Dylan Larkin set a career-high in points this season with 63 and his peak performance score was 21.5, third-highest on the team. They also have Anthony Mantha who clocked in with a score of 18.0 after setting career highs in goals and points this season. Both Mantha and Larkin are among the seven Red Wings 25 or younger at season’s end.
18. The Most Interesting Team – Vegas Golden Knights – 310.8

The Vegas Golden Knights tied the Sabres for the most players to have their peak performances on a different team with 12. For the Golden Knights, it makes sense. They were an expansion team this season and their roster was made up of players who had some success elsewhere. James Neal was one of these players and tied for the team lead in peak performance score at 30.3. He had his peak season in 2011-12 when he was a member of the Pittsburgh Penguins, scoring 40 goals and posting 81 points.
Even with a roster of players with success on other teams, a majority of their players set a career high in at least one category this season. William Karlsson, who tied Neal in peak performance score, was one such player. His 43 goals and 78 points were both career highs. Vegas had eight forwards with a peak performance score of at least 10.0 but only one defenseman, Colin Miller, reached that score.
The Golden Knights are also interesting because, when looking at the oldest peak season on each roster, they had the most recent. That accolade belongs to Marc-Andre Fleury for his 2011-12 season with the Penguins when he had 42 wins, his highest. The Golden Knights are the only team to have their oldest peak in this decade.
Teams 17 and 16: Both Disappointing Teams this Season
17. Ottawa Senators – 310.8 (top peaks: Marian Gaborik – 32.0, Bobby Ryan – 26.5, Craig Anderson – 24.0)
16. Calgary Flames – 317.3 (top peaks: Johnny Gaudreau – 28.5, Sean Monahan – 23.8, Mike Smith – 17.5)
Teams 15-11: One on the Way Up, One on the Way Down, Two Stagnant Teams, and the Champs
15. Philadelphia Flyers – 318.5 (top peaks: Claude Giroux – 34.0, Sean Couturier – 26.8, Brian Elliott – 20.3)
14. Vancouver Canucks – 321.8 (top peaks: Daniel Sedin – 36.3, Henrik Sedin – 35.3, Anders Nilsson – 7.5)
13. Minnesota Wild – 326.3 (top peaks: Eric Staal – 36.3, Zach Parise – 34.8, Devan Dubnyk – 17.0)
12. Washington Capitals – 329.3 (top peaks: Alex Ovechkin – 45.4, Nicklas Backstrom – 34.5, Braden Holtby – 18.5)
11. Pittsburgh Penguins – 335.0 (top peaks: Sidney Crosby – 42.8, Evgeni Malkin – 40.8, Matt Murray – 13.0)
10. All Offense, No Goaltending – New York Islanders – 345.3
The Islanders are inside the top-10 and by a sizable margin with more than a 10.0 point lead over the Penguins. The Islanders have elite forwards with high peaks led by John Tavares with a score of 31.0. His peaks both came in 2014-15 when he scored 38 goals and had 86 points and was a Hart Trophy finalist. In second place is Jordan Eberle at 27.5 for his 2011-12 season when he was with the Oilers. That season he had 34 goals and 76 points to lead the team in both categories.

Besides Tavares and Eberle, there are five Islander forwards with peak performance scores of at least 20.0. They have an additional six others with scores of at least 10.0. What kept the Islanders from climbing higher in the ranks is, unsurprisingly, their goaltending.
Jaroslav Halak had the highest peak score at 15.5 with his career-high .926 SV% occurring with the St. Louis blues in 2011-12 and his 38 wins were during the 2014-15 season. Halak’s score of 15.5 isn’t high compared to other goaltenders and the lack of separation between he and Thomas Greiss’s 11.5 are cause for concern because it points to an absence of a clear-cut starting netminder, which kept them out of the playoffs this year.
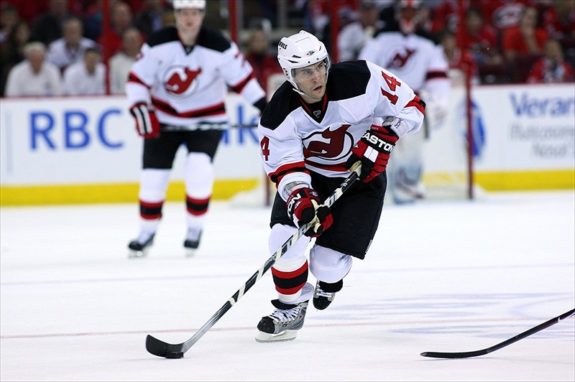
9. The Playoff Surprise – New Jersey Devils – 346.3
The Devils have great consistency in their peak performances with 17 of their 21 skaters accumulating scores of at least 10.0. Eight of these players set a career-high in either goals or assists this season, an indication of how they were able to return to the playoffs for the first time since 2012. The best of these is Taylor Hall, who set career highs with 39 goals and 93 points leading to a peak performance score of 33.0.
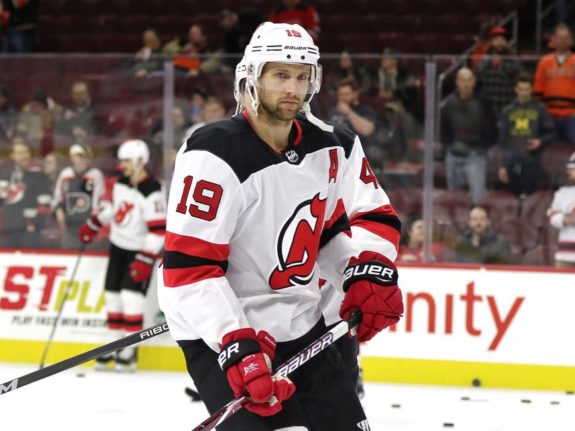
Second on the team is Travis Zajac who had a score of 23.0 for his 2009-10 season when he had 25 goals and 67 points, both career bests. Zajac’s peaks also tied for New Jersey’s oldest peak performances. In net, Cory Schneider paces the team with a score of 18.3 due to his 27 wins in 2015-16 and his .937 SV% in 2011-12 when he was a Canuck and made 28 starts.
8. The Up-and-Comers – Toronto Maple Leafs – 347.3
The Maple Leafs have one of the best combinations of young and old on this list. They have Auston Matthews and Mitch Marner, both 20 and in their sophomore seasons, as well as Patrick Marleau who is 38 and in his 19th season. Therefore it’s fitting that Marleau and Matthews pace the team in peak performance scores. Marleau’s 32.5 is five more than Matthews’ 27.3 in second place.
Marleau reached his score with a 44-goal campaign in 2009-10 and by posting 86 points in 2005-06, both as a member of the San Jose Sharks. Matthews achieved both of his peaks in his rookie campaign, the 2016-17 season when he netted 40 goals and had 69 points. Beyond Marleau and Matthews, the Maple Leafs have five forwards with scores of at least 20.0, including Marner, William Nylander, Thomas Plekanec, James van Riemsdyk, and Nazem Kadri.
On the blue line, they have four defensemen with scores of at least 10.0 led by Morgan Rielly at 15.3. In net, Frederik Andersen is their go-to with a score of 14.0, well ahead of his backup, Curtis McElhinney at 2.5. Andersen’s 38 wins this season is a career-high and his .923 SV% as an Anaheim Duck in 2013-14 is his highest mark.
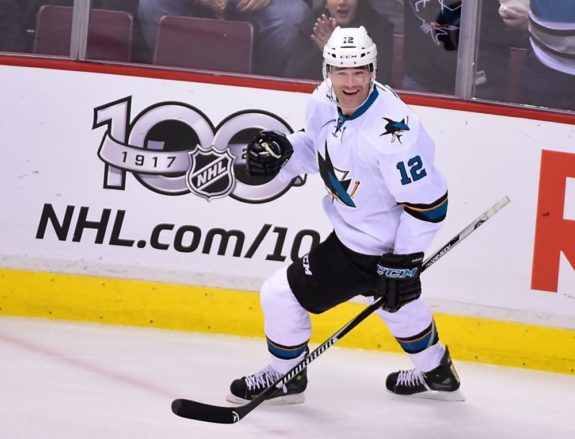
7. The Old but Still Contending – San Jose Sharks – 352.5
The Sharks are an older team that continues to win and be a Stanley Cup contender each season. They have several elite players who have had high peaks throughout their careers and are led by 19-year veteran Joe Thornton with a score of 40.3. Thornton’s peaks occurred over a decade ago with his 125 points in the 2005-06 season as a member of the Boston Bruins and Sharks.
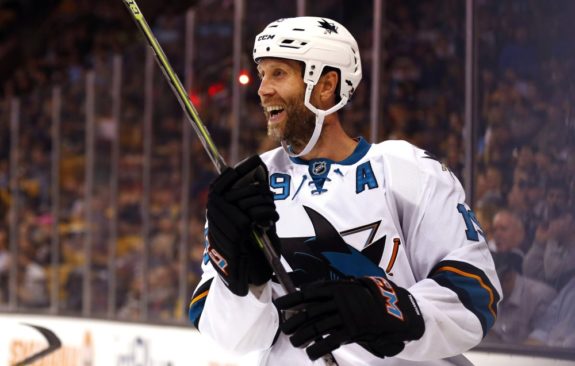
His career-high in goals, occurred even earlier, during the 2002-03 season when he scored 36 as a Bruin and that peak is the oldest for any player in the league. With “Big Joe” leading the Sharks, it is only fitting the “Little Joe” Pavelski is second at 30.0. Pavelski’s peaks both occurred during the 2013-14 season when he scored 41 goals and had 79 points, leading the team in both categories and finishing seventh in MVP voting.
Another interesting player is Brent Burns at 26.3, the highest score for any blueliner in the league. During the 2016-17 season, Burns scored 29 goals and 76 points en route to a Norris Trophy, and his 29 goals were the highest since Mike Green scored 31 in 2008-09 and the second-highest this century. In goal, the Sharks have Martin Jones leading the way with 10.8, the result of a .918 SV% and 37 wins, both during the 2015-16 season.
6. Lacking in Elite Scorers but Well-Balanced – Nashville Predators – 352.5
The Predators peak performance scores are indicative of their general roster construction in 2017-18. Similar to how they didn’t have a player score 65 points this season, they also had no player go above 26.0 in peak performance. Instead, they had 11 players with scores of at least 15.0.

They were led by Ryan Johansen and Scott Hartnell, both at 26.0. Johansen had 33 goals in 2013-14 and 71 points the following season playing for the Columbus Blue Jackets both years. Hartnell peaked in goals and points in 2011-12 while playing for the Flyers with 37 goals and 67 points. Other Predators with scores of at least 20.0 are Filip Forsberg, Viktor Arvidsson, and Kyle Turris.
Again, similar to how the Predators perform on-ice, their elite blue line stands out in peak performance. Roman Josi and P.K. Subban lead the position at 19.0 each while Mattias Ekholm and Ryan Ellis both have scores of at least 11.0. In net, Pekka Rinne runs away, with a score of 18.8 for his .930 SV% in 2010-11 and his 43 wins from 2011-12, the latter which led the league.
5. The Biggest Surprise – Columbus Blue Jackets – 353.5
The Blue Jackets are one of the most surprising teams on this list. Most wouldn’t think of them as an elite offensive team but, here they are, ranked fifth. Each of Columbus’s top two performers, Thomas Vanek and Artemi Panarin, were acquired by the Blue Jackets within the past calendar year.
Vanek, who leads the team with a score of 31.8, peaked in goals and points during the 2006-07 season with 43 goals and 84 points while playing with the Sabres. Panarin scored a career-high 31 goals last season with the Blackhawks but peaked in points this season with 82 and scored 28.3 in peak performance. Additionally, the Blue Jackets have two others with scores of 20.0-plus and six more with at least 15.0.
Two of these are defensemen, Zach Werenski and Seth Jones, who broke out this season. Jones totaled 18.3 in peak performance with a career-high 16 goals and 57 points this season. Werenski scored 15.8, matching Jones in goals this season for a career-high with his 47 points from last season being a career best.
What sets Columbus apart from other teams is their performance in net with Sergei Bobrovsky, who added 20.3 to the team’s total. His career-high .932 SV% occurred in 2012-13 and his 41 wins from last season were his highest. He won a Vezina Trophy in both seasons. Behind Bobrovsky is Joonas Korpisalo with 6.5 points, quite a separation but understandable given Bobrovsky is among the game’s elite.
4. A Lethal Offense – Winnipeg Jets – 370.0
There is a significant gap between the Jets in fourth and the Blue Jackets in fifth, and the separation of 16.5 is second only to the gap between the Rangers and Sabres. A quick glance at the Jets roster and it’s easy to see why the Jets are fourth. They have been stacked all season and only got stronger when they added Paul Stastny at the trade deadline. They have seven players with scores of at least 20.0 and four of their defensemen are above 10.0.
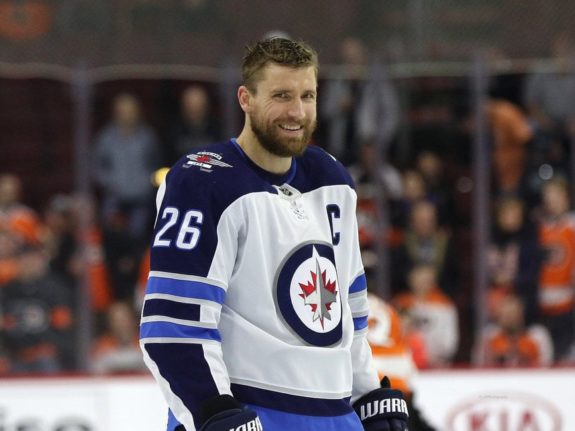
Leading the roster is Blake Wheeler at 29.8 for his 28 goals in 2013-14 and his 91 points this season. In second there is a tie between Mark Scheifele and Patrik Laine at 28.5. Both of Scheifele’s peaks occurred last season with 32 goals and 82 points. Meanwhile, Laine’s best performances came this season with 44 goals and 70 points.
Stastny, whom the Jets added at the deadline comes in fourth with a score of 26.8 for his 28 goals and 79 points, both as a member of the Avalanche. On the blue line, the Jets have a productive group led by Dustin Byfuglien with a score of 19.0. Both of Byfuglien’s peaks occurred during the 2013-14 season with 20 goals and 56 points.
In net, Connor Hellebuyck had his breakout this season with a .924 SV% and 44 wins to give him a score of 17.0. Backing him up is Steve Mason at 15.3 for his .929 SV% in 2014-15 with the Flyers and his 33 wins in both 2008-09 with Columbus and 2013-14 with the Flyers. Mason’s 2008-09 season ended with a Calder Trophy win and a runner-up finish in Vezina Trophy voting.
3. The Steady Veterans – Boston Bruins – 376.8
The Bruins wouldn’t be anywhere near the top of this list had they not signed Brian Gionta and acquired Rick Nash midseason. Both players have peak performance scores above 30.0 and both players’ peaks occurred while playing for other teams. Gionta leads the Bruins with a score of 34.3 for his 48-goal, 89-point season in 2005-06 with the Devils.
Brad Marchand is second with a score of 31.0. He reached this score for his 39-goal campaign in 2016-17 and his matching 85-point seasons in 2016-17 and 2017-18. In addition to Gionta, Nash, and Marchand, Patrice Bergeron, David Pastrnak, David Krejci, and David Backes all have scores above 20.0. On the blue line, the Bruins are actually a bit underwhelming. Zdeno Chara, Nick Holden, and Torey Krug all have scores above 10.0 but they also have three defensemen below 6.0.
In net, Tuukka Rask has a peak that rivals the best goalies in the league. He had a .931 SV% in 2009-10 and 37 wins last season to give him a score of 19.3. What is interesting about Rask is that neither of his peaks occurred when he won the 2014 Vezina Trophy. Even his backup, Anton Khudobin, is better than most backups with a score of 10.8.
2. High-End and Balanced Scoring – Tampa Bay Lightning – 386.0
Of the Lightning’s 21 skaters, just four have peak performance scores less than 10.0 and have two players with scores of at least 30.0, Steven Stamkos and Nikita Kucherov. Stamkos leads the Lightning at 39.3 with 60 goals and 97 points in 2011-12. Kucherov has a score of 35.0 with a 40-goal campaign last season and 100 points this season.
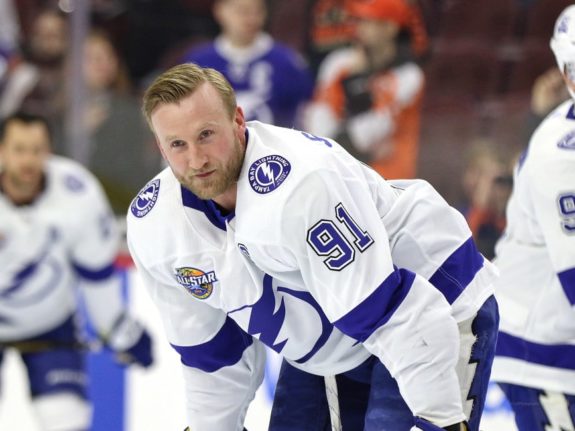
In addition, there are eight others with scores of at least 20.0. These include rookies Brayden Point and Yanni Gourde. On defense, five of the seven blueliners at season’s end have scores of at least 10.0 with Victor Hedman in front with a score of 22.3, eight more than Ryan McDonagh for second. Hedman reached his total by scoring a career-high 17 goals this season and posting 72 points last season.
In net, Andrei Vasilevskiy excelled in his first year as a starter this season. He won a career-high 44 games and had a .920 SV%, also his best. Together, these peaks lead to a score of 11.0 for the Russian netminder.
1. The Best Peak Roster is the Anaheim Ducks – 398.3
I did not expect the Ducks to have the highest peak performance score. Even after looking at their roster, it still seems improbable but their individual scores confirm it. They have two players with scores of at least 30.0, four more with at least 20.0, both goaltenders at 14.0 or above, and only two players with scores less than 10.0.
In first place is 2011 Hart Trophy winner Corey Perry with a score of 37.0. Although he hasn’t scored 40 goals since the 2013-14 season, Perry scored 50 in his MVP season to go along with a career-high 98 points. Not far behind him is captain Ryan Getzlaf at 30.5. He scored 31 goals in 2013-14 when he was runner-up in Hart Trophy voting, and he had 91 points in 2008-09.
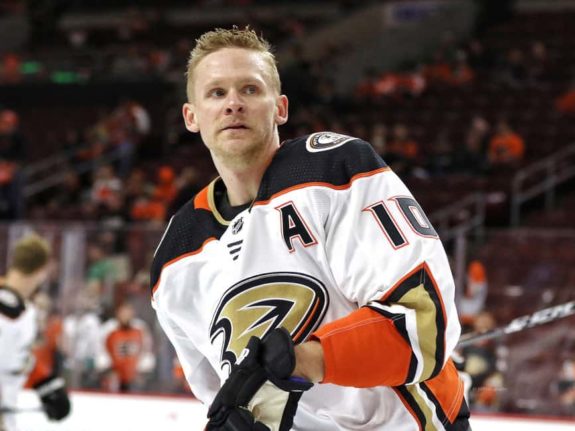
Although the Ducks tied for the sixth-oldest roster, they have six skaters who had peak performances in at least one category this season. These include Rickard Rakell who led the team in goals and points. The Ducks also have a productive defense with all seven with scores above 10.0.
At goalie, they are one of a few teams whose backup peaked higher than their starter. Backup Ryan Miller has a score of 19.3 due to winning the Vezina Trophy with the Sabres in 2009-10. Meanwhile, starter John Gibson scores 14.8 after setting career highs in SV% and wins this season.
The Wrap-up
General Takeaways of Peak Performances
Of the top 10 teams by peak performance scores, nine qualified for the playoffs this year. The only team that didn’t qualify was the Islanders due to their poor goaltending which was highlighted in their team write-up. At the opposite end is the Avalanche, the only team in the bottom 10 to reach the postseason. I feel this is due to 10 of their 21 skaters having scores less than 10.0. This combats their elite scorers like MacKinnon and Rantanen.
Additionally, Tampa Bay, Boston, Winnipeg, Columbus, San Jose, and New Jersey all added a player at the deadline who scored at least 50 points in a season. These additions went a long way to propelling their teams into the top 10.
Goaltenders mattered a great deal in this exercise. Four of the top 10 teams have a backup goaltender with a performance score of at least 10.0. However, there were also five teams that lacked a backup goaltender with the minimum starts to be included. These are Calgary, Detroit, Los Angeles, Pittsburgh, and Vegas and it certainly affected their ranks.
Surprises
I originally thought the teams with the highest point totals would either be Stanley Cup contenders that are younger or older teams that had high levels of success in the recent past. Instead, what happened is that the Penguins and Capitals ranked 11th and 12th and both are in the playoffs. Both teams have elite scorers and fill out their rosters with quality depth players.
Meanwhile, the Blackhawks, winners of three Stanley Cups since 2010, ranked 25th despite having elite talent like Patrick Kane and Jonathan Toews. Along the same vein are the Devils and Blue Jackets, who ranked ninth and fifth, respectively. The Devils ranked higher than I anticipated given their lack of elite talent, and the same goes for the Blue Jackets.
Let me know what you think of this exercise and how your favorite team fared.
*All stats and information came from Roster Resource and Hockey-Reference.
Free Newsletter
Get Advanced Stats coverage delivered to your inbox
In-depth analysis, breaking news, and insider takes - free.
Subscribe Free →