The moment you all have been waiting for is finally here – it’s playoff time. With playoff time comes loads of predictions from all of the experts and hardly any of them are right. For the past three years, I have been working on creating a mathematical formula that has the ability to predict who will win the Stanley Cup. Last year, the formula ran for the very first time and it correctly predicted 14 of the 15 Stanley Cup matchups, failing only in the Finals. After a year of optimization with the help of the fantastic Nick Biss, we are ready to run the formula again. The 2013-2014 playoffs pose a particular challenge to us because the format of the playoffs changed and teams shifted conferences. It will be interesting to see if the formula can be as accurate as it was last year.
Disclaimer: These picks are purely for speculative purposes and should not be used for gambling. For this reason, the actual formula will not be shown anywhere in this article, but the results will be published here.
The Matchups
Eastern Conference
Atlantic Division
1. Boston Bruins vs. 4. Detroit Red Wings
The Boston and Detroit matchup is an incredible Original Six matchup. On paper, this looks to be a very close battle. Detroit is 3-1 against Boston this season and has owned Tuukka Rask, a Vezina Trophy candidate. Detroit is getting healthy with Henrik Zetterberg and Jonathan Ericsson potentially returning at some point in the first round and Boston has cooled off in the last couple of games. Can Detroit pull off the upset? Our model suggests no. While Detroit has played very well of late, they fall short when compared to Boston in several key predictors. The three biggest predictors of playoff wins are points percentage in road games, even strength for/against, and Fenwick puck possession. Boston is superior to Detroit in all three of those categories and should defeat Detroit in the first round.
The pick: Boston
2. Tampa Bay Lightning vs. 3. Montreal Canadiens
Tampa Bay and Montreal is another tight matchup. The Canadiens have been steady all season long and find themselves in the playoffs for the 81st time. The Lightning on the other hand traded away their captain, lost their goaltender to an injury and are not certain of the severity, and had a key player arrested for possession of cocaine. Our model will be run as if Bishop will be playing. Our model finds this matchup to be extremely tight, but Tampa Bay’s edge in even strength for/against and fenwick puck possession leads to their series victory
The pick: Tampa Bay
Metropolitan Division
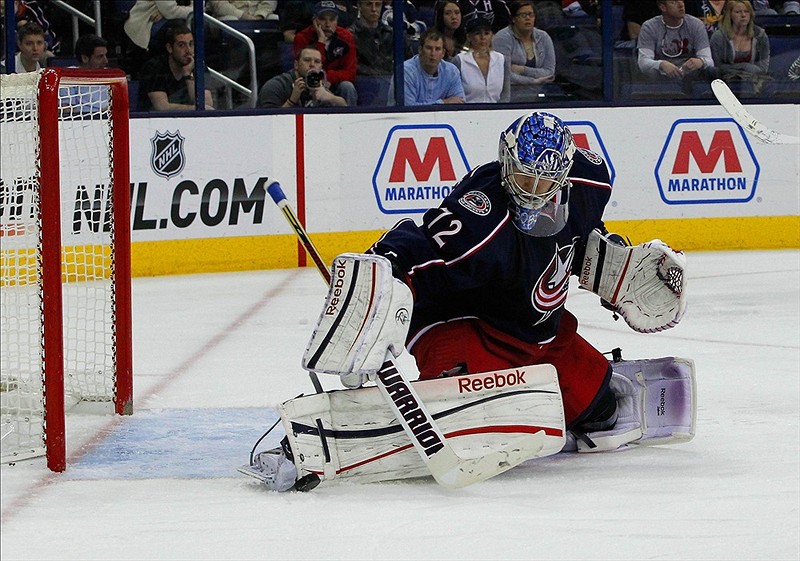
1. Pittsburgh Penguins vs. 4. Columbus Blue Jackets
This is a matchup that could soon turn into a rivalry. The cities are separated by just 162 miles and both play an entertaining style of hockey. The Penguins have limped through the last bit of the season, struggling with injuries for most of the season. The Jackets on the other hand caught fire after the Olympic break and surged to the 1st wildcard spot. Our model suggests that Columbus will pull the upset against Pittsburgh and move on to the next round.
The pick: Columbus
2. New York Rangers vs. 3. Philadelphia Flyers
Old-time hockey. Nasty rivalry. This is going to be the most physical first-round series without a doubt. Both teams have played well of late, and are coming into the playoffs with a lot of confidence. After slow starts for both Henrik Lundqvist and Claude Giroux, both found their games and have been stellar. While we think this will be a close matchup on paper, our model strongly favors the Rangers.
The pick: New York
Western Conference
Central Division
1. Colorado Avalanche vs. 4. Minnesota Wild
Colorado has been the biggest surprise of the season. New head coach Patrick Roy has led the Avalanche to the second best record in the Western Conference one year after finishing last in the Northwest Division. The Wild on the other hand managed to squeak into the playoffs for the second year in a row. The additions of Zach Parise and Ryan Suter haven’t pushed the Wild to the top of the West like planned, but they are still a very dangerous team. However, our model does not find Minnesota to be a significant threat to Colorado.
The pick: Colorado
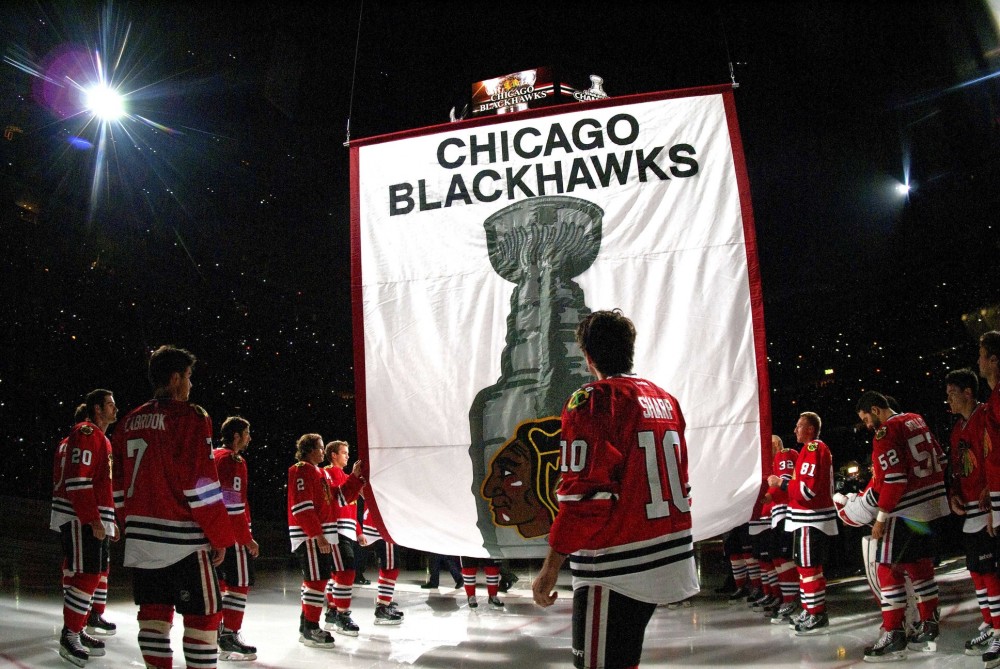
2. St. Louis Blues vs. 3. Chicago Blackhawks
Oh boy is this one going to be a doozy. These two teams do not like each other one bit. With the addition of Ryan Miller, the St. Louis Blues seem to have shored up their goaltending issues. However, they are riding a six-game losing streak into the playoffs which is never a good sign. The Blackhawks on the other hand are the defending Stanley Cup champions. Automatically I am required by law to inform you that no team has repeated since the 1997-1998 Detroit Red Wings. Our model suggests this will be an extremely close series (thanks Sherlock), but when you factor in the Blackhawks playoff experience, the model gives the slight edge to the ‘Hawks.
The pick: Chicago
Pacific Division
1. Anaheim Ducks vs. 4. Dallas Stars
Anaheim cruised the regular season, clinched the top seed in the Western Conference, and yet they probably have the most questions. The Ducks have been pegged by many experts as a team that is vastly overrated. Last year, the second-seeded Ducks fell to the Red Wings in the first round and most are expecting a similar fate this year. However, our model really doesn’t like the Stars. The Stars have a very low points percentage on the road (46.3%), have zero playoff experience, and have performed poorly in one-goal games (45.7% winning percentage).
The pick: Anaheim
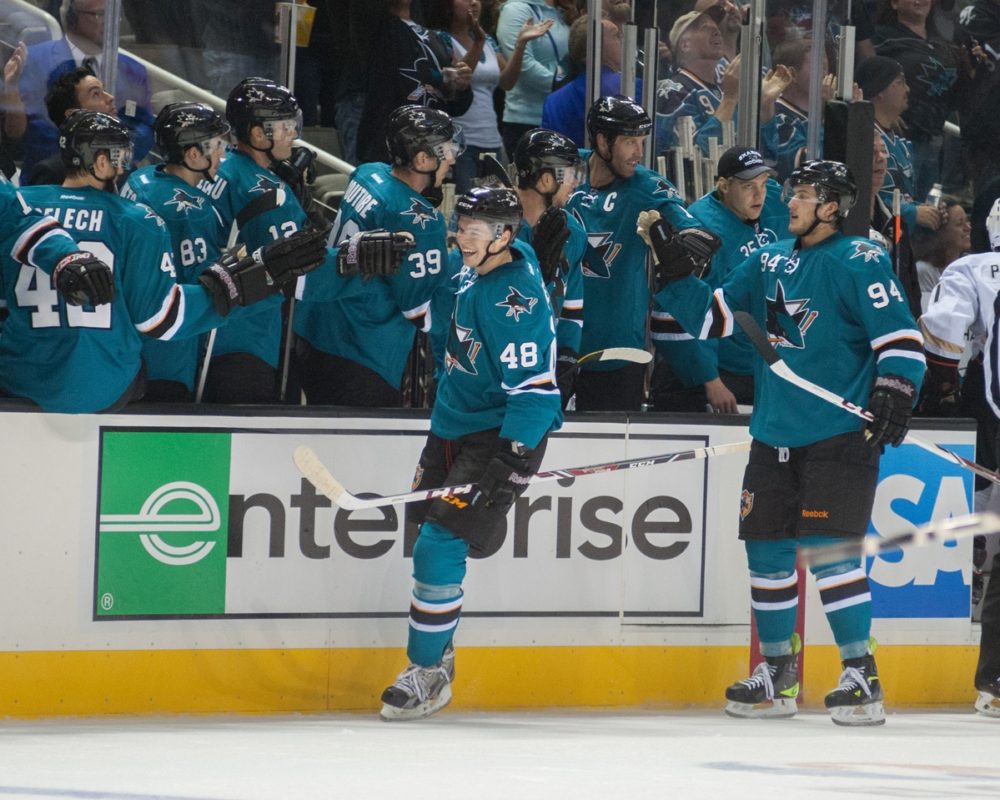
2. San Jose Sharks vs. 3. Los Angeles Kings
Maybe I lied earlier when I said that the Rangers-Flyers series was going to be the most physical. This “California Series” will be an instant classic and quite possibly the one of the best matchups in recent years. Experts have been tabbing the Sharks to win the Cup for years and they have disappointed every year. The Kings on the other hand surprised everyone by winning the Cup as the #8 seed. The model loves both of these teams, but unfortunately only one can prevail. Los Angeles is a slight underdog but unfortunately does not meet all three criteria most commonly found in a “seed upset” over the last 10 years (better PK%, more hits, better faceoff percentage) and thus San Jose is the pick.
The pick: San Jose
Below you’ll see the results of what our model generated. The “Totals Model” is based on data going back to the 1997-1998 season and the “Post-Lockout Model” is based on data going back to the 2005-2006 season. It’s important to look at both models because of the rule changes that occurred after the 2004-2005 lockout as well as a change in the officiating. For the purposes of predictions, we are using the Totals Model, but the if the Post-Lockout Model suggests that the Totals Model is incorrect, we will look more in-depth at the individual variables and assess their predictability.
| Totals Model | Post-Lockout Model | |
|---|---|---|
| #1 Boston Bruins | 19.78705212 | 27.57385859 |
| #4 Detroit Red Wings | 15.30541063 | 19.54882841 |
| Regular Season Comparison | ||
| #2 Tampa Bay Lightning | 15.58662159 | 16.17963659 |
| #3 Montreal Canadiens | 14.2992761 | 15.53327283 |
| Regular Season Comparison | ||
| #1 Pittsburgh Penguins | 19.22536263 | 23.9925068 |
| #4 Columbus Blue Jackets | 20.13014917 | 20.56990744 |
| Regular Season Comparison | ||
| #2 New York Rangers | 19.02353995 | 22.22730007 |
| #3 Philadelphia Flyers | 15.8639349 | 16.47093015 |
| Regular Season Comparison | ||
| #1 Anaheim Ducks | 19.66334532 | 21.835077 |
| #4 Dallas Stars | 15.08794085 | 15.76238668 |
| Regular Season Comparison | ||
| #2 San Jose Sharks | 21.03385212 | 25.3489342 |
| #3 Los Angeles Kings | 20.3345372 | 25.0408521 |
| Regular Season Comparison | ||
| #1 Colorado Avalanche | 17.56628341 | 18.00163056 |
| #4 Minnesota Wild | 14.59624129 | 15.6212052 |
| Regular Season Comparison | ||
| #2 St Louis Blues | 18.49286788 | 19.96439271 |
| #3 Chicago Blackhawks | 18.32007424 | 27.28951341 |
Unlike last year where we released all the picks at once, we decided to wait until the end of each round. This is so we can accumulate data from each round and use that in the playoff model. As you can see, based on regular season statistics alone, our model likes a San Jose Sharks vs. Columbus Blue Jackets final. When we compare the these teams to our historical model that looks at each championship team since 1968, the model prefers San Jose over Columbus, but it remains to be seen. Check back in after the end of round one to see an analysis of our first round picks as well as who we think will move on in the second round!