Over the past couple of weeks, I’ve been taking a closer look at a handful of rookies debuting in the NHL this season and in doing this, I’ve been tracking their development. With a focus on their ice time, I’ve been able to gain a better understanding of the way ice time can both hinder and foster rookie development in their first year as a pro.
Statistical analysis is derived from data and the more numbers there are to work with, the more reliable an analysis will be. So far, all my analyses have been on elite scorers, which are generally players who’ve been drafted in the first round. It’s easy to see where their progress does and does not lie because their job is to score goals.

As the elite scorers they are, constant point production makes statistical analysis rather simple since they’re producing the numbers. When they’re responsible for scoring, metrics such as number of goals, assists, shots on goal, missed shots, attempted shots blocked, etc., happen often and that makes sense.
However, for players who aren’t elite scorers, which are usually forwards not drafted in the first round and most defensemen regardless of the round they’re drafted in, how can we accurately define their progress as NHL rookies? There are many roles for players within their team’s system which don’t demand frequent shooting on the net. Just because scoring isn’t their job, doesn’t mean their job isn’t just as important.
The Dvorak Progress Report
This is the case for Christian Dvorak, a rookie debuting in the NHL this season with the Arizona Coyotes. Selected at No. 58 (second round) in the 2014 Draft, Dvorak plays centre and currently has a point per game played (P/GP) rate of 0.44.

As you can see in the graph above, Dvorak is not an elite scorer. In November, he finally started scoring some goals and ever since, he’s been steadily increasing his shots on goal. In fact, he’s scoring a goal every 6.5 shots on goal (SOG) now and has increased his shots on goal to once every 10:37 in November, from once every 48:07 in October. That being said, scoring goals is not and may never be part of Dvorak’s role in Arizona’s system.
The amount of time he spends on ice during games doesn’t affect him in the same ways it does other rookies. While some rookies are more effective in their role when given less ice time, others are most effective when given more. With Dvorak, it seems that he’s most effective when shift length is increased.
Dvorak’s Role in Arizona
Recently, I’ve started using a new method to chart a player’s performance in games.
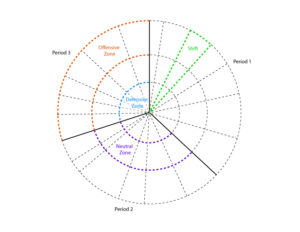
This pie graph represents one game and each bolded “slice” represents the first, second and third periods of that game, and their size reflects the TOI played that period. Within each bolded slice are “mini slices” which represent the player’s shifts that period and their size reflects each shift’s length.
Unlike previous pie graphs I’ve used for charting player TOI, this one maps the offensive, neutral and defensive zones that events occur in.

In the pie graphs above, we have Dvorak’s on-ice events charted from six different games. The size of each pie represents the minutes Dvorak played that game in comparison to each other. The dots inside each pie graph represents an event by Dvorak and their color indicates the event type.
You’ll notice that I’ve selected games with both many and few total minutes played. Since Dvorak takes faceoffs, I’ve included them in the charts as well. As you can see, he incurs events regardless of minutes played, or length and frequency of shifts. However, we will see patterns emerge in his faceoffs. Throughout these six games, Dvorak’s faceoffs occurred in the following zones:
- Forty-seven percent of faceoffs happened in the offensive zone.
- Thirty percent of faceoffs happened in the neutral zone.
- Twenty-three percent of faceoffs happened in the defensive zone.
This is great. The majority of Dvorak’s faceoffs should be happening in Arizona’s offensive zone and they are. The goal for Dvorak is to continue taking faceoffs in the offensive zone and one way to track this is by charting which zones his faceoffs occur in, over time. This will tell us if his faceoffs are increasing in the offensive zone and decreasing in the defensive zone like they should be.
The Effect of TOI on Dvorak
Throughout these six games, Dvorak’s faceoffs occurred in the following periods:
- Thirty percent of faceoffs happened in the first period.
- Forty-one percent of faceoffs happened in the second period.
- Twenty-eight percent of faceoffs happened in the third period.
This is where TOI starts to have an effect on Dvorak. Throughout these six games, Dvorak averaged exactly 33% of his total TOI in each of the three periods. Meaning, he spent the exact same amount of time playing hockey in all three periods, yet 41% of faceoffs occurred in second periods. This now raises two questions:
1) Why are the majority of Dvorak’s faceoffs happening in the second period?
2) Are increased faceoffs better or worse for a team?
Even though Dvorak plays the same TOI in each period, his average shift length in second periods is 56.6 seconds. That’s 21.2% more than his average shift length in first periods and 11.6% more than his average shift length in third periods.
Perhaps Dvorak’s shift length is determined not by a maximum exertion point but rather, the length of time it takes him to take care of his assigned responsibilities. Perhaps a more accurate way to describe Dvorak’s performance in second periods is that he plays more responsibly.
Let me explain.
A faceoff is a restart in play and gives each team an opportunity to gain possession of the puck. Meaning, if Arizona is good at winning faceoffs, then increased faceoffs game after game could very well be part of their long-term strategy to success.
The benefit of generating faceoffs is that it creates opportunities to gain possession of the puck and the benefit of winning faceoffs is that it generates possession of the puck. Dvorak’s role in Arizona is not focused on scoring goals or getting assists, even though that sometimes happens. Rather, his role is completely focused on generating faceoffs and then winning them.
Free Newsletter
Get Advanced Stats coverage delivered to your inbox
In-depth analysis, breaking news, and insider takes - free.
Subscribe Free →