Zach Werenski of the Columbus Blue Jackets is one of the hottest rookie defensemen in the NHL right now. Game after game, he’s getting points and a whole lot of ice time. Whether it’s a win or loss, his point production remains the same. Werenski’s beginning to create an identity for himself; an idea people get when they think about him and this idea is turning him into the most consistent man alive.
The many emotions of Zach Werenski. #CBJ pic.twitter.com/1Ch0f5cnxU
— John Wooten (@wooten) November 21, 2016
Currently, Werenski’s point per game played (P/GP) rate is 0.88 and that’s a whole lot higher than Erik Karlsson’s P/GP (0.78). Over the last couple of years, Karlsson’s been gaining media attention because he’s led all NHL defensemen in points since the 2013-14 season. The Swedish defenseman is a two-time winner of the Norris Trophy as the NHL’s best defenseman, winning them in 2012 and 2015. He’s been mentioned in the same sentence as Bobby Orr and he’s even made Sportsnet Magazine’s cover for the March 2016 issue, ‘How-To Be The Best Defenceman on Earth.’

Werenski could very well be the next Karlsson or maybe even better. The question everyone’s asking about the 19-year-old defensive star from the University of Michigan is, how long will his offensive prowess last?
To put it bluntly, Karlsson can say goodbye to his three-year reign for most points by a defensemen. We cannot only expect Werenski’s elite point-producing abilities to last, but also increase.
Werenski vs Marner
In a recent article, I discussed the impact Mitch Marner has on the Toronto Maple Leafs and how much they rely on him to win games. Although Werenski isn’t as heavily relied on to win games as Marner is, there’s still a great deal of responsibility placed on his very broad shoulders.
Let me explain.
When it comes to Marner, the Leafs have not yet won a game in which he hasn’t scored. Statistically speaking, when Marner scores, the game’s already won. In fact, the differences in Marner’s gameplay are astronomical when comparing metrics between games won and lost. With Werenski, his stats present themselves in a similar manner… except he can still score in games lost.
In games won, Werenski:
- Gets a point every 15:47
- Scores a goal every 6.7 shots on goal
- Registers an assist every 21:43
- Has a P/GP of 1.38
Like Marner, Werenski maintains the same amount of shots on goal in both games won and games lost (shoots on goal every 8:43).
In games lost, he:
- Gets a point every 52:10
- Scores a goal every 12 shots on goal
- Registers an assist every 104:20
- Has a P/GP of 0.45 (which is higher than the average NHL defensemen’s P/GP)
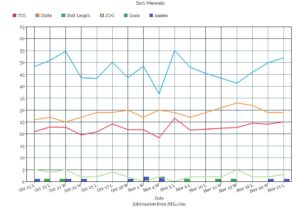
When looking at Werenski’s stats, we can see two things: consistency and growth. For the most part, his shots on goal run parallel to his time on ice (TOI). Meaning the more ice time he gets, the more shots on goal he takes. This is especially true in October. However, on Nov. 5 when the Blue Jackets played against the St. Louis Blues, Werenski saw the most ice time to date but wasn’t able to take any shots on goal. In fact, the only other time he had zero shots on goal was on Nov. 1 when playing against the Dallas Stars.
The Zach Werenski Progress Report
Werenski plays a 200-foot game, has a nose for the net and rarely incurs penalties. He also takes 2.6 shots on goal each game, so when he’s not getting shots, there’s a problem. Although the Blue Jackets were victorious over the Stars, an area of weakness for Werenski may be hidden in games where he lacks shots on goal.
Werenski’s a rookie who’s never played less than 18:24 in a game. His average TOI is 22:29 per game and this is one of his biggest differences as a rookie. He has the highest average ice time per game played of all the rookies who have debuted in the NHL this season. Clearly, higher than average rookie TOI isn’t a weakness for Werenski.
Except, it actually might be.
After using a new method to analyze data, a method similar to the one LinkedIn used to use when measuring content reach with the free account, it turns out that there may be a pattern found in minutes played each period.
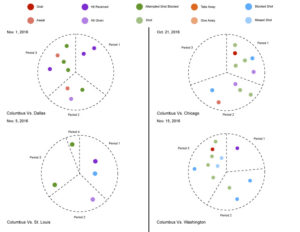
In the graphs above, we have Werenski’s on-ice events charted from four different games. Each section of the pies represent one period and the size of each “slice” reflects the TOI Werenski played that period. The dots inside each pie represent an event by Werenski and their color indicates the event type.
The two games on the left side are the two games mentioned previously when the Blue Jackets played against Dallas and St. Louis. These are the only two games Werenski didn’t get any shots on goal in. The two games on the right side are the two games Werenski got the most shots on goal. In these two games, he got five shots on goal each.
You’ll notice the “slices” representing the first periods in games on the right are smaller than the first periods of games on the left. Werenski played up to 3:26 minutes longer in the first periods of games he had zero shots on goal in. Furthermore, in the first period of the Nov. 15 game, he didn’t have any shifts longer than 00:44. In the first period of the Nov. 5 game, Werenski had four shifts more than a minute long and three shifts just under a minute, plus a few short, but sweet shifts. This could reveal a pattern in Werenski’s gameplay and the effect TOI actually does have on him. However, we’re only looking at four games here and that’s not enough to come to any concrete conclusions, although it may be a good starting point worth exploring later.
Patterns Found in Games Lost
Generally speaking, most defensemen don’t score a lot of goals. In fact, defensemen tend to score fewer goals than forwards. In the case of Werenski, though, he scores more goals and registers more assists than most forwards in their prime, so I’ll be using the same metrics to track the progress of forwards in Werenski’s analysis, as well as additional metrics for tracking defensemen.
In games the Blue Jackets lost, you’ll notice clusters of takeaways, giveaways, and hits. It’s understandable that Werenski would have more events occuring in games lost. However, you’ll also notice his giveaways and takeaways only occur in games lost. This could be used as an indicator in future games, to determine how well or poorly the Blue Jackets are playing against the opposition. To date, Werenski only has giveaways and takeaways when the Blue Jackets end up losing the game.
Werenski’s Consistencies
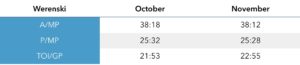
**P/MP = Point per minute played
***TOI/GP = Average time on ice per game played
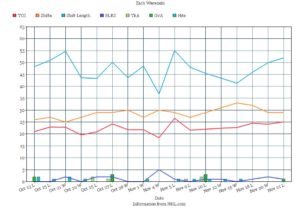
In the month of October, Werenski registered an assist every 38:18, and continues to register an assist every 38:12 in November. His average time on ice has increased slightly to 22:55 per game in November, from 21:53 per game in October. This may be a good thing, though, because based on the stats of other rookies, the majority are most effective when playing less than 18:00 per game.
Werenski’s Growth

**GvA/MP = Giveaways per minute played
***G/SOG = Goal per shots on goal
Although Werenski’s SOG/MP has decreased to one shot on goal every 11:28 in November (from one shot on goal every 6:23 in October), his goal per shots on goal (G/SOG) increased to one goal for every 6.7 shots on goal in November (from one goal scored for every 12 shots on goal in October).
Of course, John Tortorella is coaching the Blue Jackets towards a new style of play, one different from what we’re used to seeing. He’s doing a lot of work with his team and it’s certainly showing. He has a strong grip on puck management, focusing on the strategic use of ice and play away from the puck. As you can see, Werenski is indeed consistent and continues to improve his game where it matters most.
Although I only compared four games where Werenski had the most and least shots on goal, he may be more effective when he can use the first period as a buffer period, playing less than seven minutes and with shifts under a minute in length. As Werenski continues to play more games, we’ll be able to uncover more patterns in his gameplay and unveil the mysteries behind his effectiveness as a rookie in the NHL.
Free Newsletter
Get Columbus Blue Jackets coverage delivered to your inbox
In-depth analysis, breaking news, and insider takes - free.
Subscribe Free →