The Montreal Canadiens are a fast team that works hard and never quits. That’s the identity they’ve been working on since head coach Claude Julien arrived in 2017; something all new players must quickly learn. One of the keys to their success is Julien’s management of ice time.
I was curious to see how the Canadiens compared to the rest of the NHL when it came to ice time management. One of the best ways to measure this is via a statistical visualization called ‘Box Plot’.
Canadiens Deploy NHL’s Most Balanced Forward Lines
Without knowing anything about Box Plot, the visual graphic below tells the story. The Canadiens are the smallest vertical bar near the middle, highlighted in yellow on the X-axis. I also highlighted the Canadiens forwards with the most and least ice time per game: Phillip Danault with 17:74 time on ice per game (TOI/GP) and newcomer Nick Cousins 12:60 TOI/GP. I also added two orange reference lines at the top and bottom of the Canadiens’ ice time distribution for easy comparison to other teams.
The Canadiens have the most balanced distribution of ice time in the NHL among the forward group. Follow the orange lines and you can explore all the players with more ice time than Danault, or less ice time than Cousins. The interactive version of this graph allows you to explore all the numbers and players by hovering over elements of the graphic.
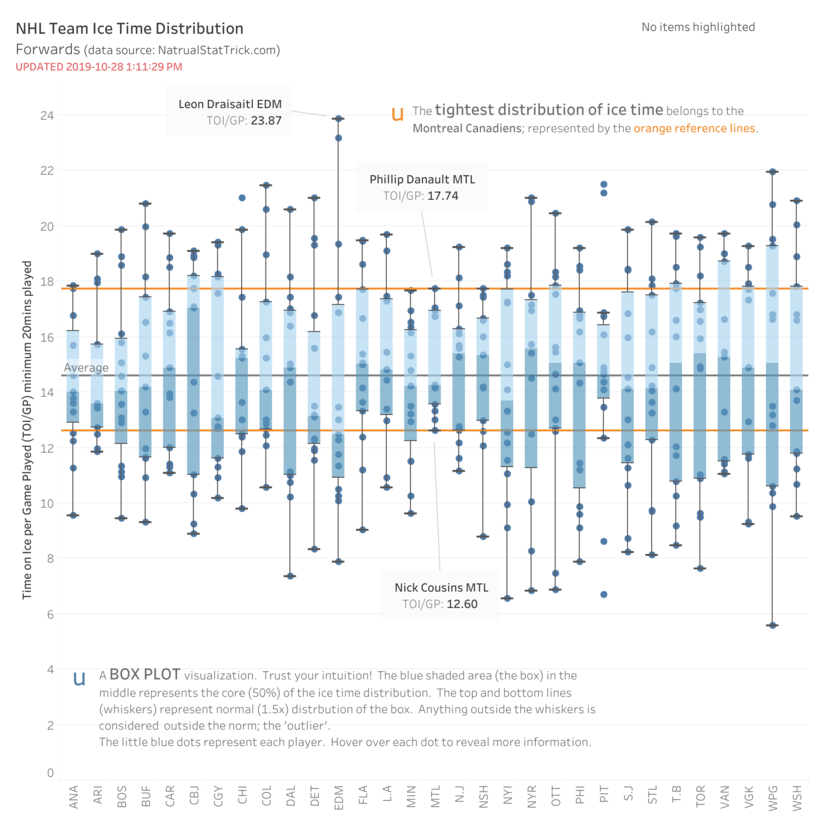
To understand the Box Plot more intimately, the dark blue dots represent players (forwards only). The blue shaded box area represents 50% of ice time distribution. The middle of the box, denoted by the separation in the blue shade, represents the median. The top and bottom black lines (whiskers) represent normal 1.5x distribution of the box. Anything outside those ‘whiskers’ is considered outside the norm or ‘outliers’. Yes, I had to watch a YouTube video to refresh my dusty knowledge on Box Plots.
Secret Behind the Canadiens’ Speed
So what does this tell us? Well, it confirms that the Canadiens indeed run a tight ship when it comes to ice time. In fact, they run the tightest ship of all teams. This may give some insight into the secret of the Canadiens’ speed and seemingly relentless, never-say-die, attack. All Canadiens forwards, especially their top forwards, get the rest needed to keep pace with Julien’s system.

The teams closest to the Canadiens in terms of ice time distribution include the Anaheim Ducks, the Minnesota Wild, and the Nashville Predators. These teams have no outliers and their top players have similar ice time to Danault. However, these teams have a distinct ‘fourth line’ group with three players on each team with lower ice time than Cousins. This means these team’s top three lines take the bulk of the ice time, whereas the Canadiens have a much more balanced distribution between all four forward lines.
Ice Time Management Trend
It’s worth noting that last season the Canadiens were one of the top teams in terms of ice time distribution and that Danault led the Canadiens forwards in ice time last season too, at 17.76 TOI/GP; almost identical to this season.
It seems that teams are increasingly playing with more pace and paying more attention to fatigue to optimize health and momentum going into the playoffs. This season, there are 12 teams deploying one forward or more with 20-plus minutes per game. Last season, there were 17 teams doing the same. It will be interesting to see if this is a trend moving forward in player deployment.
For the Canadiens, this type of ice-time distribution is a key component of the team’s identity; something Julien continues to work on. It has fostered team cohesion and internal competition. It likely has led to injury avoidance. These are key ingredients for winning in a league with an increasingly slim margin of error. It has solidified their reputation as one of the best five versus five teams in the league. A team that won’t quit or back down.
Free Newsletter
Get Montreal Canadiens coverage delivered to your inbox
In-depth analysis, breaking news, and insider takes - free.
Subscribe Free →