Thursday’s loss to the Dallas Stars marked the quarter point of the NHL season for the Vancouver Canucks. Technically, one-quarter of 82 games is 20.5 which would fall in the second period of last game against the Colorado Avalanche. Although, is anyone actually counting? Disregard the official quarter-way point.
Truly, the main importance of this time period is that there are finally enough games played to produce a fair sample size towards setting expectations for the remainder of the season. Everything can still change in a heartbeat. Last season the Canucks were only one point ahead of this current squad and fell to 23rd place by the season’s end. Without further ado, it seems right to dissect some underlying themes of the Canucks top forward lines this season thus far.
Dominance for the Top Guns
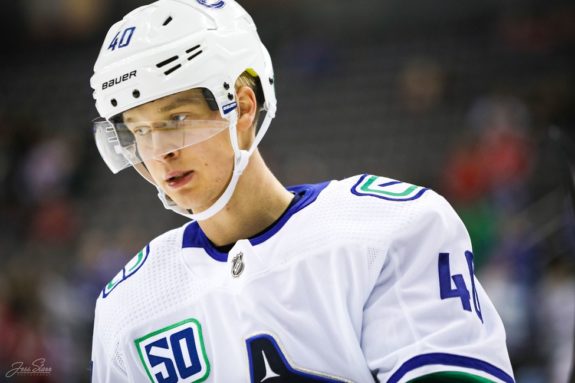
Unsurprisingly, Elias Pettersson is leading the team in scoring again. Third-year player, Brock Boeser, elevated his game from his sophomore campaign and is playing at a point per game pace. Linemate, JT Miller, has had an exceptional start through his first twenty games with the Canucks after being traded from the Tampa Bay Lightning. All three linemates rank in the top 25 in league scoring, which is a feat that even the historic West Coast Express line could not achieve.
The dynamic “Lotto Line” (their jerseys numbers are 6-40-9, get it?) are equally as impressive defensively. Some may argue that they seem to dominate other teams’ top lines in the offensive zone resulting in barely having to play defence in their own end. That is not to take away from the flashes of brilliant defending when it has been necessary.
Including all NHL lines that have played more than 90 minutes together, Vancouver’s top line owns the largest percentage of expected goals scored out of the combined expected goals scored for and against while they are on the ice.
To analyze this, expected goals are calculated from shot quality (distance, angle, off a rebound and so on) and Pettersson’s line has 7.3 expected goals while only allowing 3.9 expected goals against. This equates to 11.2 total expected goals when this line is on the ice and 65.2 percent of those are in favour of Vancouver’s line. To summarize, the Lotto Line dominates the league in both ends for shots that are the most likely to result in goals.
What about the masterful Connor McDavid and Leon Draisaitl line or the lethal Boston Bruins trio? The Edmonton Oilers’ top line leads the league in expected goals for (shocker!). However, none of the lines that outproduce the Canucks line comes close to their superb expected goals against total.
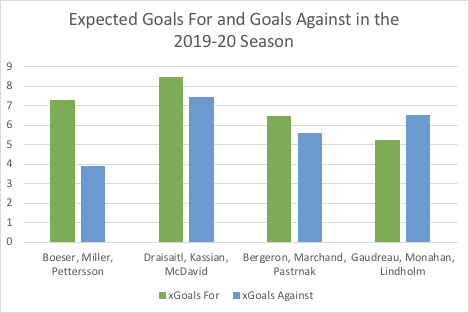
This graph displays the expected goal totals adjusting for each line playing the same number of minutes (169 minutes which is the amount Vancouver’s line has logged together). It becomes clear that the Oilers line has the highest-octane offence at the expense of allowing high quality scoring in their own end, resulting in barely more on the positive than the negative side of the equation. Vancouver possesses the highest discrepancy between goals for and against while the Calgary Flames top line has allowed more than they have generated.
Horvat and Lack of Secondary Scoring
While the top line is producing, the Canucks could use some improvement from their supporting forward lines.
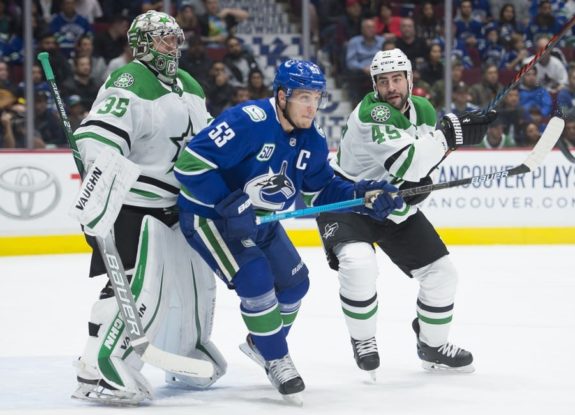
It starts with the captain. Bo Horvat’s 15 points in 19 games are not disappointing at first glance. However, five of his six goals have been power-play goals playing alongside Pettersson, Boeser, and Miller. His lone even-strength goal came on an empty net against the Detroit Red Wings. However, Horvat seems poised to bounce back.
He leads the team in high danger scoring chances with 18 and has an expected goals total 2.4 goals higher than his actual amount. Further, his shooting percentage is down approximately two percent from his career average despite having the highest percentage of offensive zone starts during his 6 seasons in the NHL. All of these signs suggest Horvat is simply in a slump that will soon be extinguished.
It does not help that Horvat has had a carousel of rotating wingers to fill out his line. Josh Leivo and Tanner Pearson have had a similar start to Horvat as they have been generating solid chances yet lacked actual production. Particularly, Leivo has displayed his talented forechecking abilities resulting in the Canucks controlling the puck 52 percent of the time while he is on the ice. Yet, Leivo and Pearson only have six combined goals thus far. Look for more execution from the Canucks second line throughout the remainder of the season.
Unavoidable Injury Bug
While the top two lines have been relatively unscathed injury-wise, the same cannot be said for the bottom half of the forward lines. Injuries to Jay Beagle, Michael Ferland, Tyler Motte and most recently, Brandon Sutter have decimated the Canucks’ depth. Respect is due, as those injuries are a testament to the team’s ninth-best penalty kill in the league.
Aces in the Circle
Current Canucks assistant coach, Manny Malhotra, might be sprinkling some of his Manny Magic onto the Canucks centers in the faceoff circle this season. Vancouver ranks first in faceoff percentage in the entire league for the first time since Malhotra was monopolizing the faceoff circles with an astonishing 62 percent for the Canucks in 2010-11 as a skater. The Canucks are converting at an elite 54 percent while centers Beagle, Miller and Horvat all rank in the top 15.
| Name | Team | Faceoff Percentage |
| 1. Steven Stamkos | Tampa Bay Lightning | 63.5% |
| 2. Christian Dvorak | Arizona Coyotes | 62.9% |
| 3. Sean Couturier | Philadelphia Flyers | 62.0% |
| 4. Brian Boyle | Florida Panthers | 60.9% |
| 5. Jay Beagle | Vancouver Canucks | 60.8% |
| 6. Claude Giroux | Philadelphia Flyers | 60.4% |
| 7. Casey Cizikas | New York Islanders | 59.4% |
| 8. J.T. Miller | Vancouver Canucks | 58.9% |
| 9. Jamie Benn | Dallas Stars | 58.7% |
| 10. Frederik Gauthier | Toronto Maple Leafs | 58.6% |
| 11. Adam Lowry | Winnipeg Jets | 58.1% |
| 12. Tomas Nosek | Vegas Golden Knights | 57.8% |
| 13. Bo Horvat | Vancouver Canucks | 57.7% |
In conclusion, the Canucks forward group have not disappointed 20 games into the season. There is still room for improvement although with players hopefully returning from injury soon and some puck luck for the secondary scorers and expected goals become legitimate goals, there is reason for optimism for the remaining three-quarters of the season.
Free Newsletter
Get Vancouver Canucks coverage delivered to your inbox
In-depth analysis, breaking news, and insider takes - free.
Subscribe Free →