Teams are typically only as successful as their goaltending is good. Or maybe it’s that a goalie’s success is reflective of the quality of players in front of him. Either way, it appears that the relationship is one of the chicken and the egg: that an argument can be made for each being the cause for the other’s effect. I feel that it is likely that both have reason to be considered the cause but am curious to know how true that is.
I looked at five goaltending trends from last season until now, both upward and downward, in order to see how they relate to the players’ team trends over the same period. The results were interesting and they helped to clarify how much a team’s talent can impact a goaltender by looking at shot quality and metrics.
Anderson’s Regression Proving 2016-17 was a Fluke
Ottawa Senators goaltender Craig Anderson was a major storyline last season, returning from extended absences due to health issues experienced by his wife. He posted great numbers, including a .940 save percentage at 5-on-5 while facing nearly 25 shots per game. He finished the season with a 25-11-4 record and propelled the Senators into the playoffs and within one goal of the Stanley Cup Final. This success came despite a 48.8 percent Fenwick that ranked 22nd in the league and tied for worst among playoff teams.
This season has been a different story as he struggles with an 11-12-5 record and an .899 save percentage. Anderson’s regression has occurred in nearly all 5-on-5 categories, including a nine percent decline in save percentages against high danger shots. He is also giving the Senators a quality start just 43 percent of the time. A quality start is considered by Hockey-Reference to be one in which a player’s save percentage in a particular game is higher than the season’s average. Last season, he recorded a quality start 62.5 percent of the time.
It is difficult to not place Anderson’s struggles directly on him. He is facing three fewer 5-on-5 shots per game this season but is saving three percent less of them. In general, the Senators are a worse 5-on-5 team this season than last, when they were notoriously bad. Their goal control has regressed from 48.9 percent to 45.3 percent and are below 50 percent for shots share, control of scoring chances, and Fenwick.

It’s easy to see why the Senators are in seventh place in the division when Anderson isn’t bailing the team out this season. The team is actually scoring at a higher rate this season (2.51 to 2.75 goals per game) but are allowing over a half goal more per game this year.
Andrei Vasilevskiy Thriving as Full-Time Starter
The 23-year old Russian netminder has had a workload increase each season since his rookie year in 2014-15. Last season, he started 47 games, including 17 of 21 after the trade deadline on Mar. 1. Vasilevskiy was good, winning 23 games, posting a .917 save percentage and a 2.61 goals-against average (GAA). His emergence as a bonafide NHL starter over the past few seasons allowed the Lightning to move on from veteran Ben Bishop.
For as good as Vasilevskiy looked last season, and his results showed he was, this season he has been elite. He currently leads the league in wins, shutouts, goals saved above average (GSAA), and goalie points share (GPS), which is the number of points he has accounted for in the team’s total. In fact, he has already eclipsed his wins and GSAA totals from last season and is less than a point away from beating last season’s points share.
Andrei Vasilevskiy leads the NHL in wins (26), shutouts (6), GAA (2.04) and SV% (.935) at the halfway point (goalies w/ min. 15 GP).
Since 1955-56, only four different goalies have finished the season leading all four categories. Details: https://t.co/NUfqIPSv1O #NHLStats pic.twitter.com/l6BrnrwEGA
— NHL Public Relations (@PR_NHL) January 7, 2018
At 5-on-5, Vasilevskiy is in the top five among goaltenders in save percentage, quality start percentage, and for the most shots faced. He is also a top-five goalie when facing low and mid-danger shots.
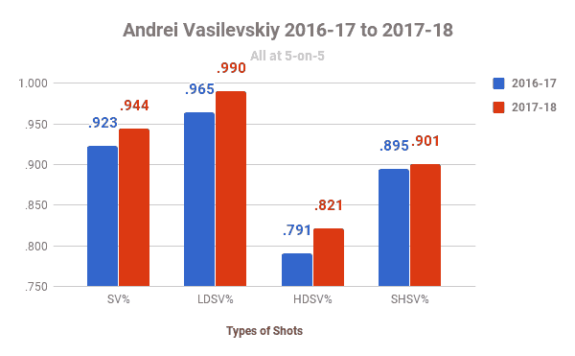
Compared to last season, he has improved in every statistical category at 5-on-5. His save percentage has risen from .923 to .944 while facing nearly two more shots per game. His improvement in save percentage has come against all three qualities of shots – low, mid, and high-danger shots with the largest increase coming against high-danger shots.
Corsica considers a high-danger shot to be one that results in a goal at least nine percent of the time. These are typically taken from close to the net or with traffic in front of the goalie. Vasilevskiy’s save percentage against these has risen from .791 last season to .821 while facing almost one more high danger shot per game.
Vasilevskiy’s biggest growth has occurred in GSAA where he was a minus-seven. This means he allowed seven more goals than the average goalie at 5-on-5 last season. This season, he is a positive-15, for a difference of plus-21 goals. That is enough growth to account for part of Tampa’s turnaround this season.
Of course, a portion of any goaltender’s success or struggles are reflective of his quality of teammates. For the Lightning, an emergence of an elite top line in addition to a healthy Steven Stamkos has made them into the top offense in the league. Last season, the team scored 2.80 goals per game while this season that average is up to 3.64.
In total, the Lightning are playing much better this season at 5-on-5. Their Fenwick is up to 52.2 percent from 50.6 percent. They are controlling 51 percent of shots and 61 percent of goals this season while they were sub-50 percent last year. All three improvements have helped make life easier on Vasilevskiy. However, the importance of knowing that he is the full-time starter cannot be understated. The step he has taken while receiving a much higher workload has equated to the Lightning being a favorite to win the Eastern Conference.
Hurricanes Still Haven’t Found Franchise Goaltender
When the Carolina Hurricanes acquired and signed Scott Darling this past summer, they thought they had found their franchise netminder. There was reason to think he could meet this expectation, given his play for the Blackhawks. In 64 starts for Chicago over three seasons, he had a 39-17-9 record with a .923 save percentage and a 2.37 GAA. He even played quite a bit better than starter Corey Crawford last season, albeit in a smaller sample size.

Since arriving in Carolina, Darling has been anything but a franchise goaltender. In 24 starts, he has an .893 save percentage, a 2.97 GAA, and a record of 8-11-6. He has struggled with consistency, having 10 games allowing two goals or less while also allowing at least four goals in seven games.
At 5-on-5, Darling’s save percentage has regressed over two percent to .909 from .937 last season. His save percentage has dropped at least one percent against all shots, including dropping from .863 to .797 against high-danger shots. Last season, Darling had a plus-16 GSAA but is at minus-six this season. His quality start percentage has also regressed from 63 last season to just 37.5 percent this year.
Darling’s downward trend is another situation where he takes nearly all the blame. Since Bill Peters took over as head coach before the 2014-15 season, the Hurricanes have never had a Fenwick below 50 percent. This season the team has a 53.3 percent Fenwick at 5-on-5, second highest in the league. Furthermore, the team has improved in control of shots, goals, and scoring chances from last season.

Even more condemning of Darling’s performance is that long-time Hurricane goalie Cam Ward is outplaying Darling. Ward has a .911 save percentage and a 2.64 GAA in 17 starts this season. His save percentage at 5-on-5 is .923, significantly higher than Darling’s. The only thing holding the Hurricanes back from being a true contender is goaltending. Darling was paid like a starter this offseason and needs to improve, especially given the high-quality defensemen playing in front of him.
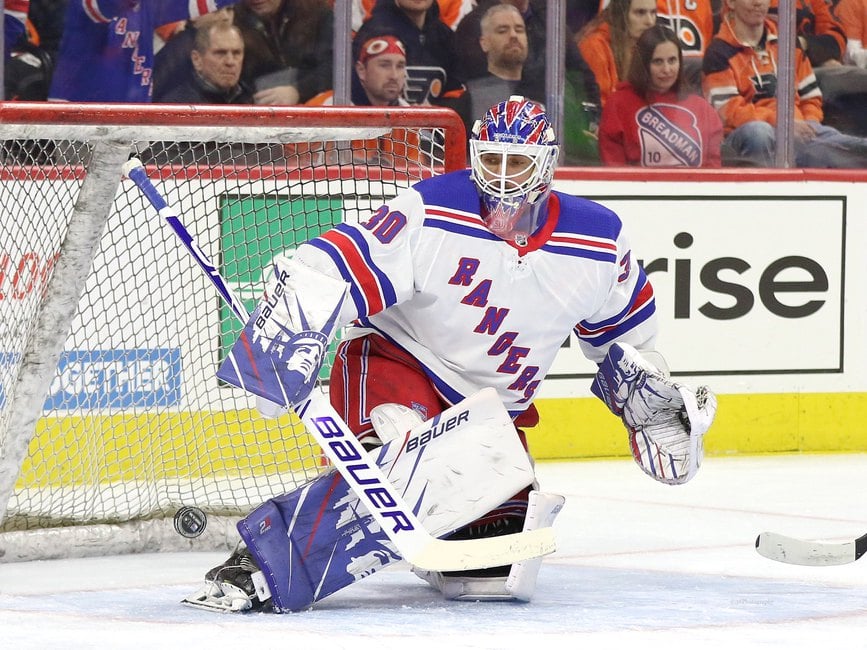
Schneider’s Rebound Powering Devils into Playoff Position
The New Jersey Devils surprisingly find themselves in a playoff spot after bottoming out last year with a record of 28-40-14. At the time of this w the Devils have a 22-11-8 record. The Devils have generally gone the way Cory Schneider has performed the past two seasons. Last year, when the team was bad, Schneider had just a .908 save percentage. This year his save percentage sits at .919, much closer to his career average of .921.
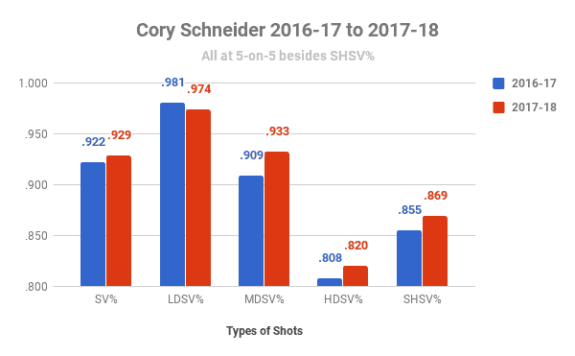
At 5-on-5, Schneider’s improvements have been noticeable, raising his save percentage from .922 to .929. He has been especially good at shutting down mid-danger shots, going from a .909 save percentage against last season to .933 this season.
What Schneider has been able to do behind what figured to be a porous defense has been amazing. The number of shots he is facing at 5-on-5 has increased as has the number of high danger shots. As a team, the Devils are a sub-50 percent Fenwick team and control less than half of shots and scoring chances at 5-on-5.
If the Devils remain in the playoff hunt for the duration of the season it will likely be a result of Schneider’s continued rebound. This is also due to how poor New Jersey’s backup goalie situation is where Keith Kinkaid has a 3.31 GAA and an .897 save percentage in nine starts.
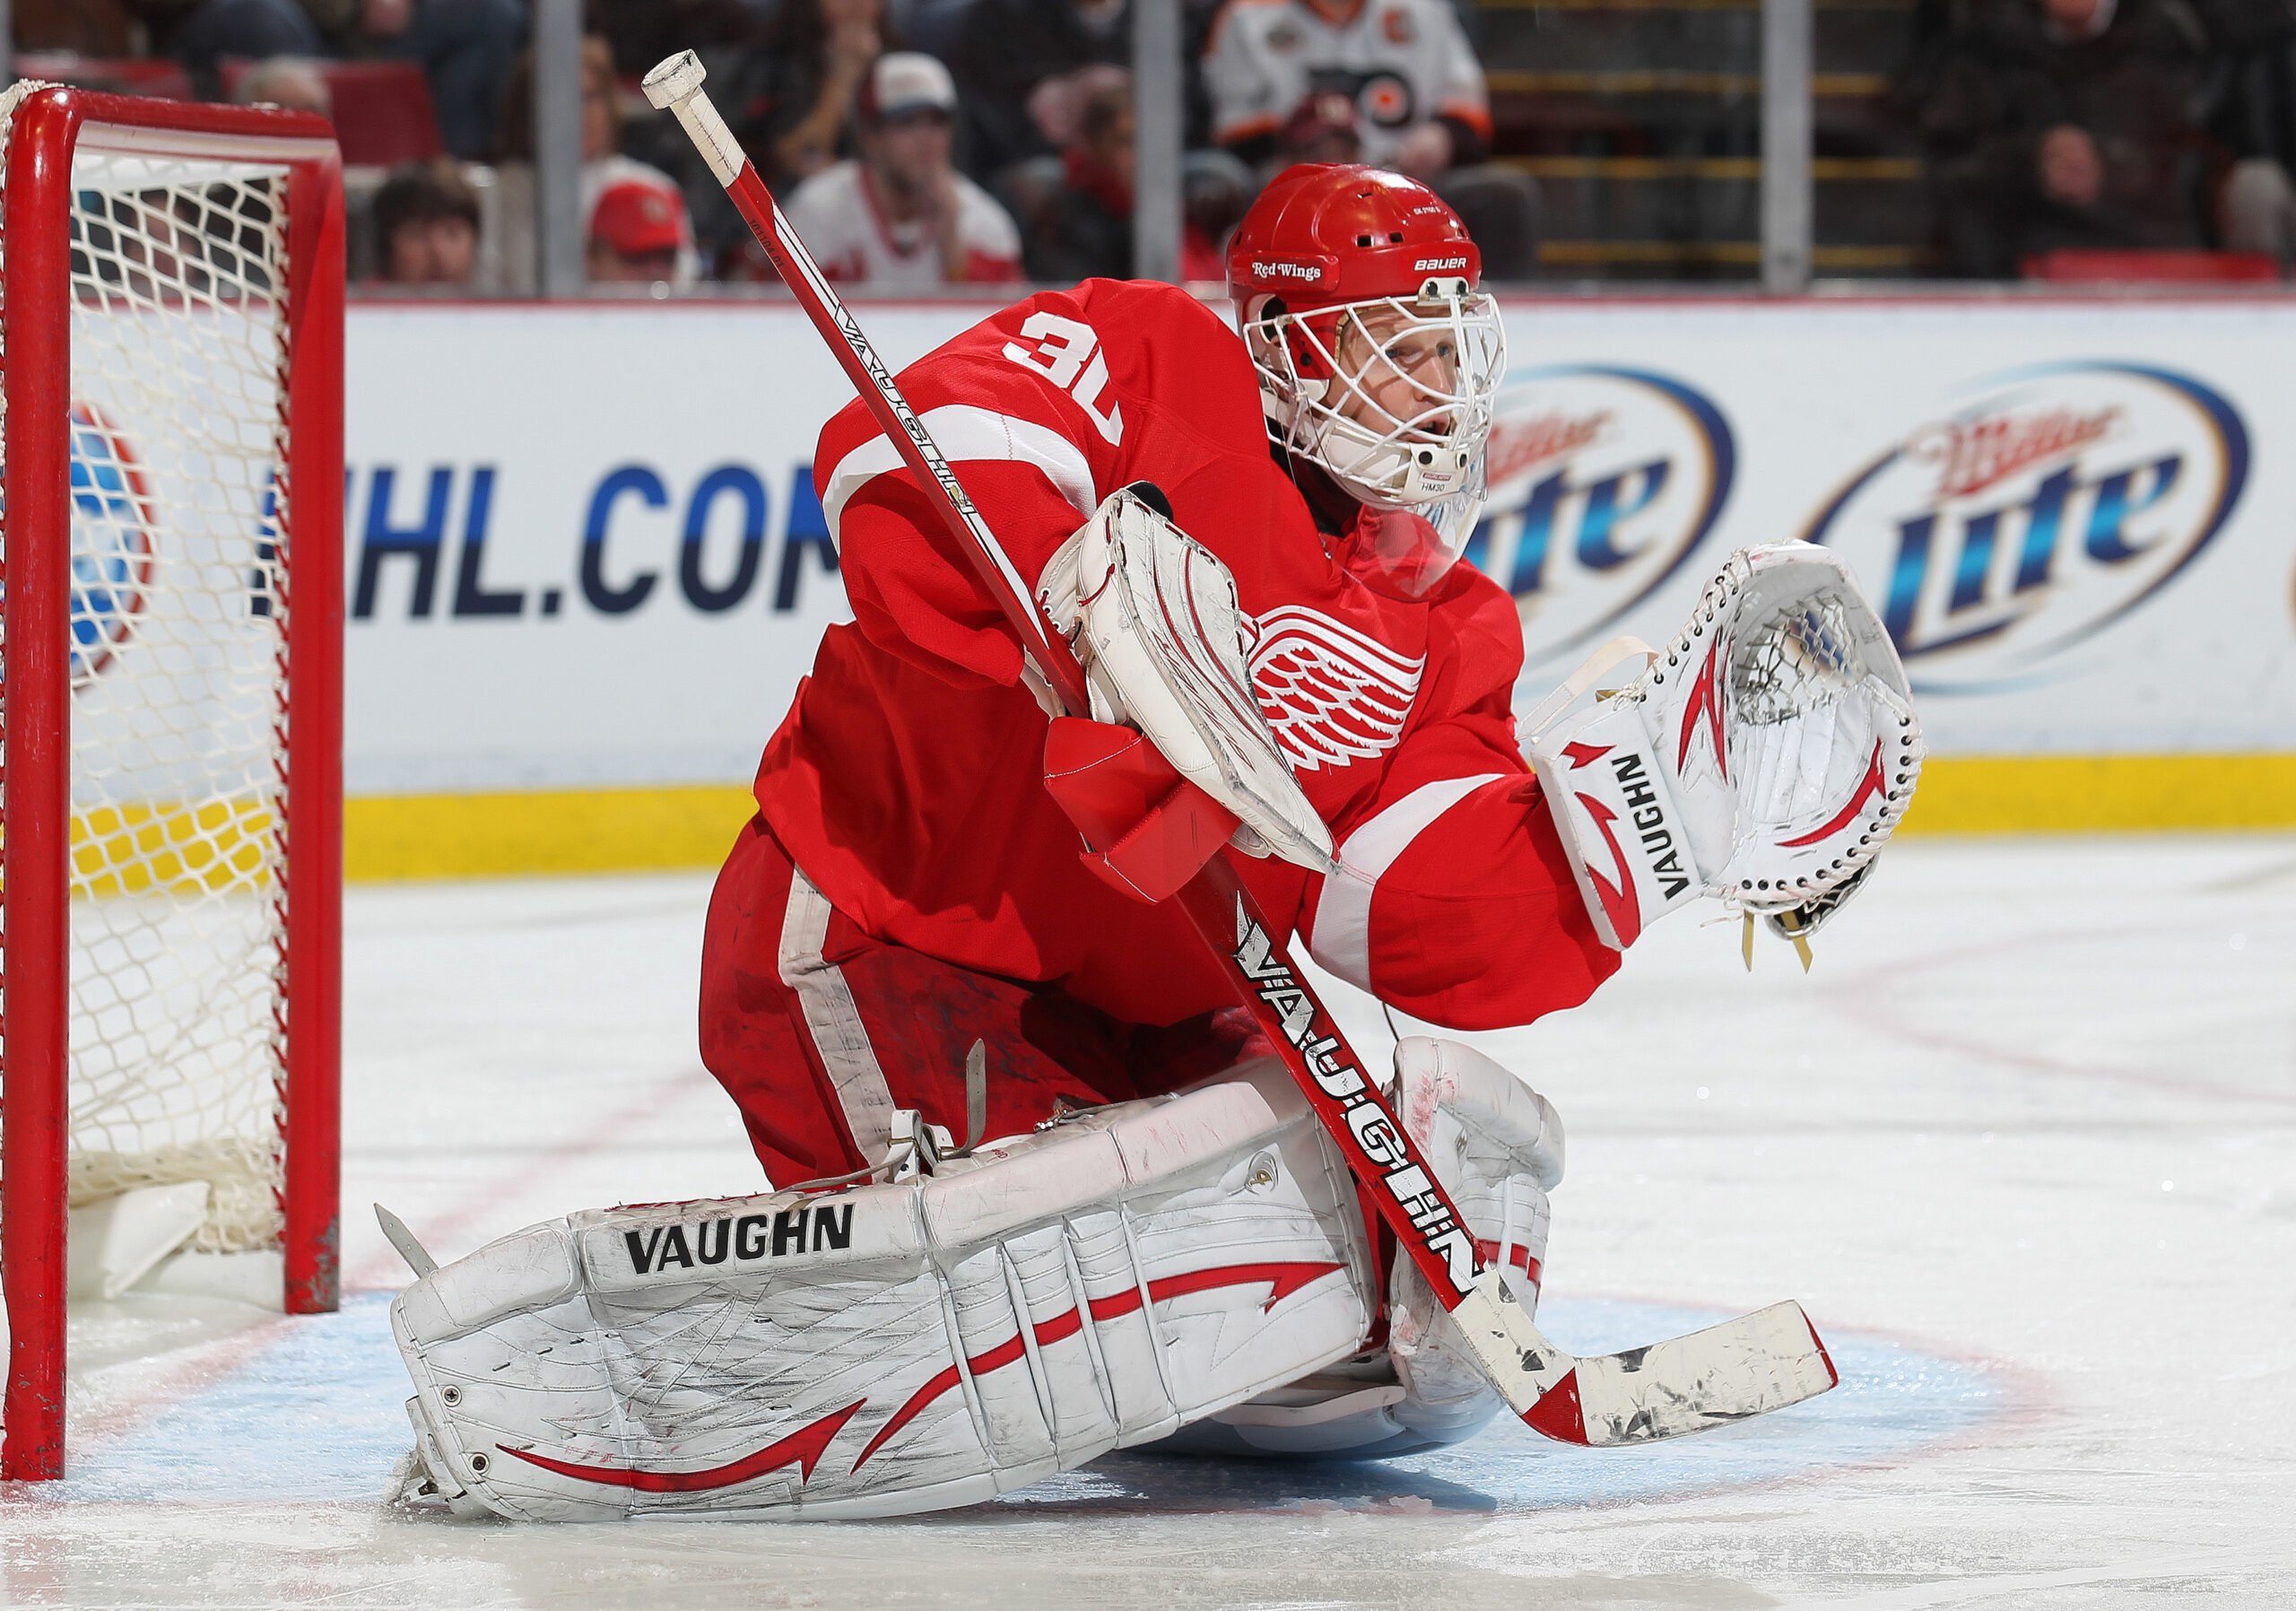
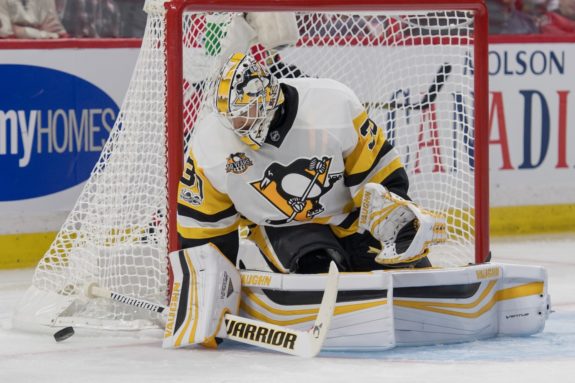
Murray’s Struggles Exposing Deeper Issues in Pittsburgh
Now in his third year in the NHL, Penguins goaltender Matt Murray has already experienced immense success. He won Stanley Cups in his first two seasons and played a pivotal role on both teams. This is especially true last year when he led the playoffs with a .937 save percentage, a 1.70 GAA, and two shutouts. He appeared to be the franchise goalie for the Penguins and the team believed in him enough to allow veteran Marc-Andre Fleury to be taken in the Expansion Draft. This season, however, after 28 starts, Murray is struggling with just a .903 save percentage and a lofty 2.93 GAA.
Murray’s regression this season should not come as a surprise based on his regular season performances the past three years. In 13 starts in 2015-16, his rookie year, Murray had a .930 save percentage and a 2.00 GAA. Last season, he started 47 games and had a .923 save percentage with a 2.41 GAA. Add to that his statistics this season and he is certainly trending downward. Similarly, his quality start percentage has dropped from 76.7 in 2015-16 to 42.9 this season.
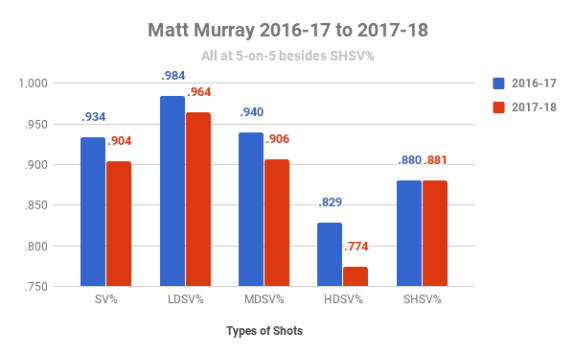
Looking at his 5-on-5 numbers exposes some of his shortcomings as he had a .934 save percentage last season and a .904 this year. When facing the range of dangerous shots, his save percentage has dropped for all three with a more sizable regression the more dangerous the shot.
What I find most interesting about Murray’s regression is that he is facing nearly two fewer shots at 5-on-5 per game this season compared to last. He is also facing fewer high danger shots per game. Typically when a goaltender faces fewer shots his save percentage increases. But when that save percentage decreases as Murray’s is, it is a sign of true regression.
Murray’s biggest issue is that he has internal competition in the form of Tristan Jarry in a similar fashion to how Murray pushed Fleury two seasons ago. In 13 starts, Jarry has a .919 save percentage and a 2.46 GAA. He also has a quality start percentage of 61.5 and two shutouts, both better than Murray. Jarry is facing fewer 5-on-5 shots than Murray, making life slightly easier on him.
Regardless of what is behind Murray’s regression, he has to rebound for the Penguins to have any chance at a three-peat as Stanley Cup champions. He was far too important to both Cup runs to play this poorly this season and expect the team to overcome it.
*All stats came from Hockey-Reference, Natural Stat Trick, and Corsica Hockey and were updated as of Jan. 8
Free Newsletter
Get NHL Goaltending coverage delivered to your inbox
In-depth analysis, breaking news, and insider takes - free.
Subscribe Free →