During the Summer of Analytics, when many of the teams were hiring bloggers, the Hockey Analytics field was hurt with the loss of great minds as well as their removing of research. One idea that was being explored this year was the idea of “Open Corsi” an area I want to re-evaluating, explore and see if the numbers still hold up.
Open Corsi is intend to look at the possession of hockey teams when they are no longer under the influence of a faceoff win or loss in each of the varying zones. While the initial values were lost, a fellow hockey analyzer and Habs’ Eye on the Prize blogger @ArikParnass has managed to salvage some of the data. Here is what he has shared.
 This data shows the number of seconds after a faceoff, in each zone and situation, as well as the league average corsi. Knowing these values is important as it allows us to look at teams specifically and see how they are playing after faceoffs, in open play, and as well at their systems to see if they have a weakness that needs to be improved upon.
This data is based on data from prior seasons, with the 2014-2015 NHL season now over 20 games into the season it is time to re-analyze these values. The first step was to acquire the data, to do that I used a custom python script to run through each NHL play-by-play sheet and counted the number of corsi events, for each team, by second after a faceoff in each zone. This data is available if you wish to play with it, contact me and I can send it to you.
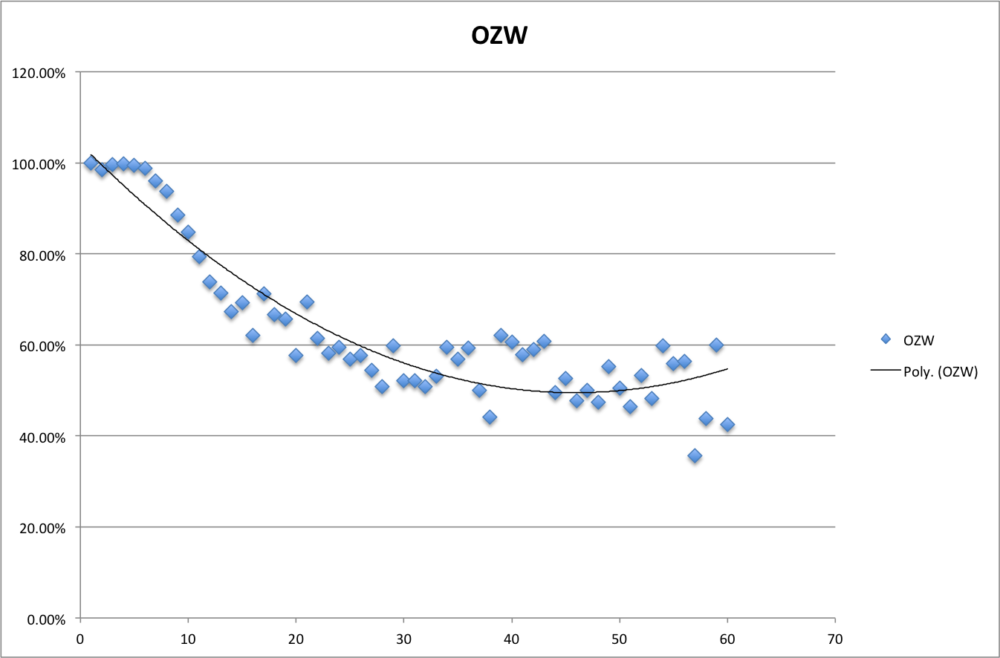
Offensive Zone Win / Defensive Zone Loss
An offensive zone win and a defensive zone loss are linked as one is the reciprocal of the other. For this I plotted all of the number events within a minute after a faceoff:
 The first thing I needed to do with this value is test to see if 37 seconds was still a valid time for the effects of the faceoff to wash out. This timing seemed really far in the future, though the league average possession numbers in that time did match. To re-measure this time length I took to twitter and asked a number of smart math people including @SteveBurtch, @IneffectiveMath, and @EliCash73, the best and easiest method to use. They suggested a number of techniques, all of which suggested that play had entered “open corsi” around the same time.
The 37 seconds mark appears to be when the trendline has reached 50%. I do not agree with this late of a period as the rate of change between the faceoff and 60% is much different than between 60% to 50%. As we consider the normal corsi bands between 40%-60% I would suggest it would be better to look when possession league wide has achieved the 60% bound (or normal bound). For an Offensive Zone Win this is 25 seconds. League average corsi for this amount of time is 83%. As the reciprocal holds true, the effects of a defensive zone loss suggest a league average corsi of 17% for 25 seconds.
Offensive Zone Loss / Defensive Zone Win
 A similar method was used for Offensive Zone Losses and Defensive Zone Wins. This suggests the effects of the faceoff wipe out after 17 seconds and the league average is 56%. The reciprocal is true for Defensive Zone Wins at 44% for 17 seconds.
Neutral Zone Win / Neutral Zone Loss
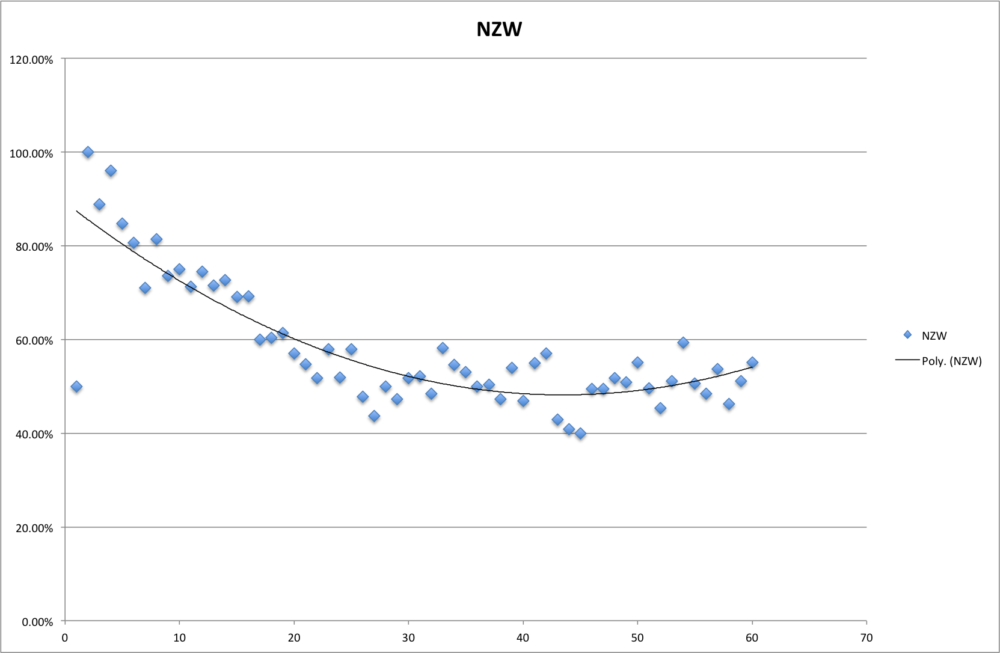 The third and final zone needs to be considered which is both the Neutral Zone Win and Loss. While intuitively it makes sense it is interesting to see there is more of an effect in winning an neutral zone faceoff and losing an offensive zone one. Using the same techniques we find that the corsi data regresses to the normal bands after 20 seconds and league average corsi in this time is 69%.
Summary
A summary of the results should now look like:
| Situation | Ozone Win | Ozone Loss | Nzone Win | Nzone Loss | Dzone Win | Dzone Loss |
|---|---|---|---|---|---|---|
| X Secs Since | 25 | 17 | 20 | 20 | 17 | 25 |
| Lg Average | 83% | 56% | 69% | 31% | 44% | 17% |
While these numbers are different than the original data, they agree in which zones have the biggest effects. All of these numbers will consistently need to be re-evaluated to see how they stand up against a larger sample size and how they change over time. For now it allows us to see how teams have been performing. The next steps will be evaluating each team in these zones, along with how the team performs within open play.
Free Newsletter
Get Advanced Stats coverage delivered to your inbox
In-depth analysis, breaking news, and insider takes - free.
Subscribe Free →