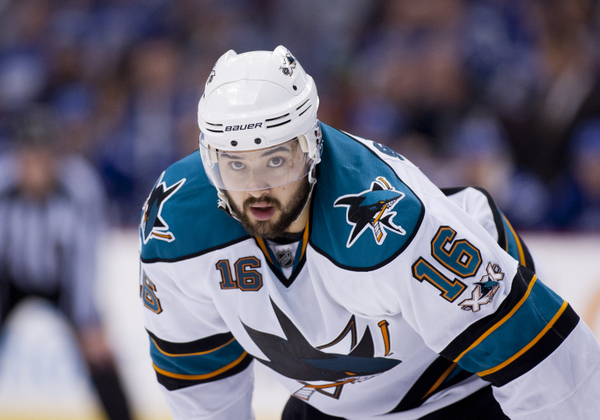
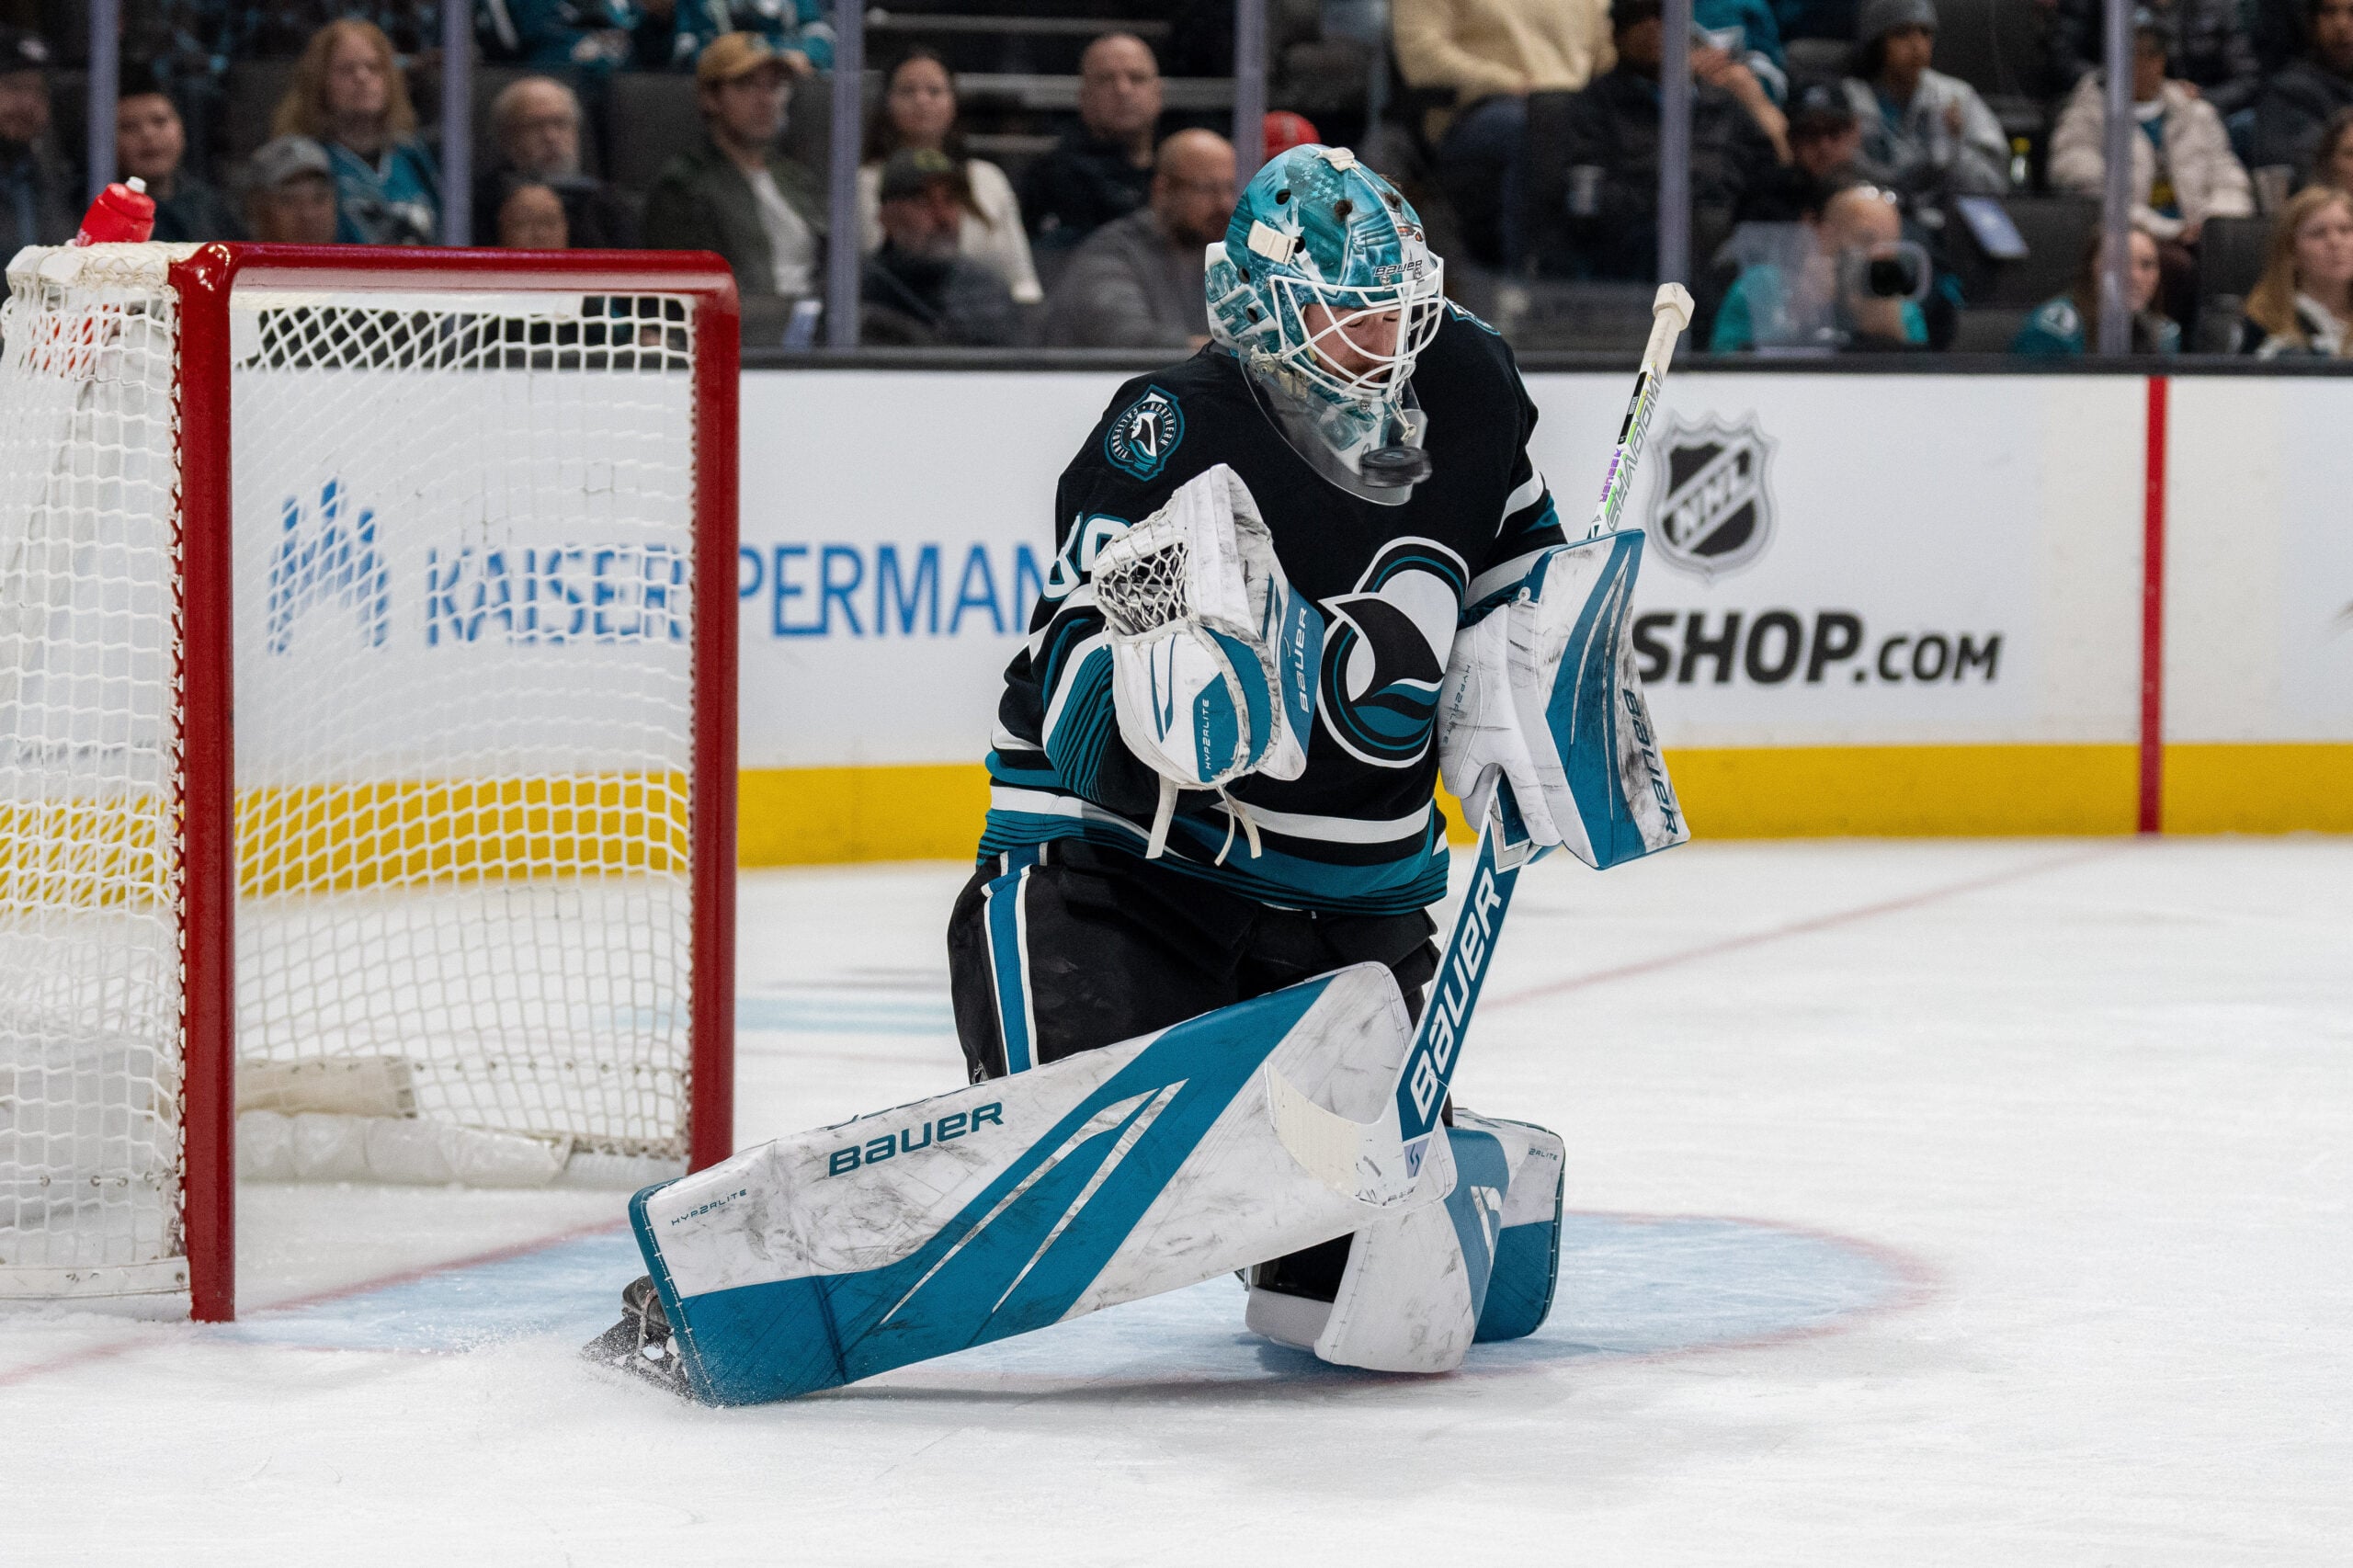
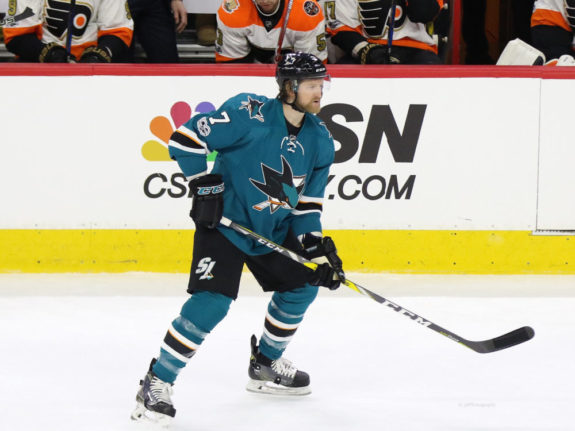
One challenge when considering San Jose Sharks defenseman Brent Burns is often this: where to begin?
Burns has been all over the map. At times he’s been the best player in hockey, and at times he’s been one of the most problematic. He tends to go on long streaks of brilliance, but also long streaks of ineffectiveness. He can be a huge asset in one aspect of the game and a huge liability in another. Once again, he’ll be the Sharks’ representative at the All-Star game.
A Burns History
I looked at Burns through the plus-minus statistic. While I know this isn’t everyone’s comfort zone, the trends are hard to cast off as random chance. With Burns, the lines tend to go sharply in one direction or the other. When the line is flat, it’s unusual. To visualize this, I’ve broken down his plus-minus into five segments (six graphs) and they’ll be presented in chronological order. In each graph, I’ve used the same scale. Each data point on the graph is cumulative plus-minus, representing six games. And each graph picks up where the prior one ended. All regular-season and playoff games are included.
Figure 1 is the 2013-14 season, when he played forward. It covers 76 games, including seven playoff games. The slope is mostly continuous upwards, and Burns finishes the season plus-21.
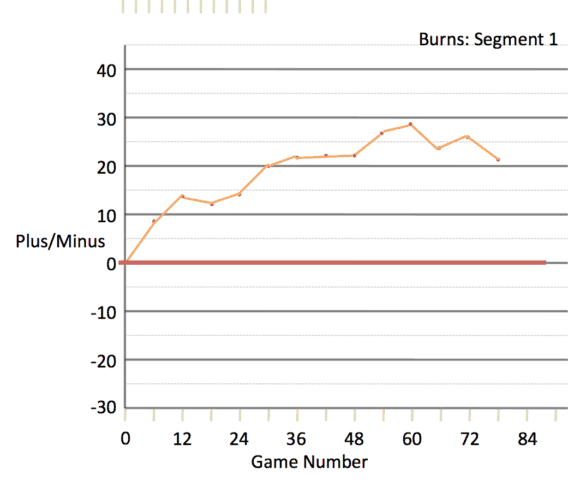
Figure 2 covers the 2014-15 season. It is the flattest of the five graphs, covering 82 games played. This season, Burns returned to defense and it is where he has played since. It is a modestly downward slope. Burns finishes the season minus-9.
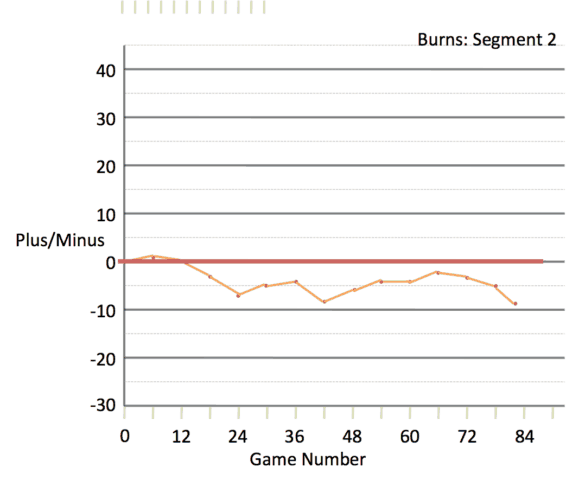
Figure 3 looks at the early part of the 2015-16 season. It covers the first 30 games of the season and is a steep downward slope. In these 30 games, Burns is minus-14.

In the middle of the 2015-16 season, Burns reversed his sharp downward trend, almost on a dime, and began a long, sharp upward trend. During this period, he was arguably the best player in the league. Figure 4a and Figure 4b cover this. This trend lasted until game 66 of the 2016-17 season. In total, this covers 142 games and includes 24 playoff games as the Sharks went to the Stanley Cup Final. Because of the number of games, I’ve made it into two graphs (the second is a continuation of the first). In this segment, Burns was plus-44.


Figure 5 begins in the latter part of the 2016-17 season. Though Burns won the Norris Trophy, his strong, positive trend reversed after game 66 (on his 32nd birthday). This final graph covers the last 22 games of this season (including six playoff games) and the first 40 games of the 2017-18 season (as of Jan. 9, 2018). Over these 62 games, Burns is minus-25.

Burns’ Ups and Downs
To summarize these five segments, I’ve scaled the plus-minus to an 82-game figure. In order, it goes, plus-23, minus-9, minus-38, plus-25 and minus-33. It is worth noting that only one out of every 15 NHL players has a plus-minus figure over 20 for a season (either positive or negative). And only around one percent of players have a plus-minus over 30 (again, either positive or negative). Yet Burns is (mostly) in these extreme areas – and in both directions!
In two of the past four seasons, he’s had a sharp reversal in the trend line within the season. This season, the line is going in only one direction, the wrong one.
The Same Brent Burns Story?
Two years ago, almost to the day, I wrote, “Burns leads all NHL defensemen in a variety of areas, including goals, even strength goals and shots — all by large margins. At the same time, he is also among the worst players in the league in terms of goals allowed. When Burns is on the ice at even strength, the Sharks are far more likely to give up a goal as compared to their team average. Surprisingly, given his offensive talent, the Sharks are also far less likely to score a goal. His tremendous athleticism has not translated to enough ‘goodness’ for the Sharks at even strength.”
This statement is mostly true again this season. While Burns isn’t leading in all the areas mentioned in the old quote, he is near the top of the league for defensemen in many offensive areas. He leads in shots taken by a defenseman by a huge margin and is tied for the league lead in ‘shots on goal per game’ with Alexander Ovechkin.

In the same article, I reported the team’s goal scoring with Burns on the ice at 5-on-5 was less than with low-scoring defenseman Brenden Dillon on the ice. It was true at this point two years ago, and it is true again this season. San Jose has scored 16 goals with Burns on the ice during 5-on-5 play and they have 21 with Dillon on the ice (statistics courtesy of Natural Stat Trick). With Justin Braun on the ice, another modest scoring defenseman, the Sharks have scored 25 times. Burns’ goals for per 60 minutes of 5-on-5 ice time is last among the Sharks defensemen. Burns sits at 1.33 for this metric; Joakim Ryan is at 1.47. The rest of the Sharks’ defensemen are all above 2.00.
As was the case two years ago, Burns, despite his remarkable shot totals, is not creating scores. Toss in his declining defensive play and you’ve got a formula which equals disaster. There are 280 NHL players who have at least 500 minutes of 5-on-5 ice time. Among these players, Burns’ 30.2 percent goals for percentage (GF%) is 280th; it is dead last. And to take this a step further, the Sharks have a positive GF%, 56 percent, when Burns is not on the ice during 5-on-5 play. This is not a case of a bad team dragging down a good player.
There is a frequently heard saying in hockey: “It’s never a bad idea to shoot the puck on net.” Yet somehow, Burns is first in shots on goal and last in GF%. How does this happen?
A Different Brent Burns Story?
Shortly after the article came out two years ago, Burns’ season turned around. Radically. He went from major liability to perhaps the best player in hockey. It was as if a light switch went on (graphically, the end of Figure 3 to the start of Figure 4a).
The Sharks need Burns to find the switch again. Or perhaps the team needs to play more effectively with Burns. It is hard to tell sometimes. Burns is such a unique player, he probably merits a system tailored to his unique abilities. Alas, NHL teams tend not to tailor systems to specific players.
Are Changes Coming?
The one jarring suggestion is to return Burns to forward. We’ve seen Burns be the best defenseman in hockey, a one-man wrecking crew on offense and more than solid on defense. This version of Burns is absent this so far this season.
There are plenty of arguments against returning Burns to forward and I won’t rehash them here. When you’re the reigning Norris Trophy winner, your upside is enormous.
Any move would be controversial, but the merits are at least worth a review. Burns was very successful as a forward in 2013-14. In term of GF%, he was 25th-best among the 544 players to have over 500 minutes of even-strength ice time (as a reminder, he’s last in the league in this metric at the moment). His 63.5-percent clip as a forward was slightly better than his 59.5-percent result during his Norris-winning season. He was 23 goals in the positive (goals for minus goals against while on the ice during 5-on-5 play) over the 69 regular-season games he played as a winger in 2013-14; he’s 21 in the negative in the 40 games thus far this season.
A move to forward would bring back one critical aspect of his game: Burns is a superb forechecker. In today’s NHL, forechecking is a huge part of the game, more important than perhaps it has ever been. Not only does effective forechecking take possessions away from opponents, but turnovers off forechecks offer some of the best scoring chances. It is hard to overstate both how critical this is to today’s game and how good Burns is in this area. He covers a lot of ground quickly and has an enormous reach. On top of which, he isn’t the guy you want bearing down on you when you’re trying to move the puck up ice. Few players of Burns’ size have anything close his mobility.
One thing different in San Jose since Burns last played forward is the quality of the team’s blueliners. Including Burns, the Sharks have eight who are NHL-capable in the organization. Marc-Edouard Vlasic and Braun are an excellent pairing. First-year NHL players Tim Heed and Joakim Ryan have demonstrated they are NHL caliber players (neither is a young player; Ryan is 24 while Heed will turn 27 later this month). Add in Dylan DeMelo, Brenden Dillon and Paul Martin (who has been out injured most of the season), and the Sharks still have a capable seven-man group, even without Burns.
Finally, the Sharks are goal-starved at 5-on-5, at the bottom of the league. If the Sharks aren’t scoring with Burns firing from the point, there isn’t much reason to keep doing it.
The Missing Element?
Something must change. Burns is an exceptional athlete. Make no mistake, while Burns can act silly at times off the ice, he is a smart, committed hockey player. In one of the game’s most challenging and least appreciated areas, the penalty kill, Burns is terrific.
There are two notable changes in San Jose this season. Former assistant coach Bob Boughner left San Jose to become the head coach for the Florida Panthers this season. Burns gave Boughner credit for turning his game around in 2015-16 and coached Burns in his Norris Trophy-winning season.
The second change is Burns’ partner. Last season, it was Paul Martin. Martin has barely played this season, as he recovers from an ankle problem. It’s worth noting, Burns began his decline last season with Martin still in the line-up. Yet, until Martin returns and is up to speed, the jury is out. Some have called Martin “the Burns whisperer,” the one player perfectly suited for playing alongside Burns and his prodigious talent.
Are the absences of Boughner or Martin the missing element? Perhaps. Boughner is not returning, while Martin might.
No matter what the issues are, one thing is clear. At 5-on-5, the Sharks are broken with Burns on the ice. The numbers, cut many different ways, all tell the same story. In his first 66 games last season, Burns was plus-24 and the best player in the NHL. In the 62 games since, he’s minus-25. If there is good news, we’ve seen things look bad with Burns before and turn positive on a dime. And even with Burns back to being a 5-on-5 liability, the team is still very much in the playoff hunt. Still, things better change for Burns, because if they don’t, there will be major consequences for this Sharks team.
Free Newsletter
Get San Jose Sharks coverage delivered to your inbox
In-depth analysis, breaking news, and insider takes - free.
Subscribe Free →