After Canada’s 9-0 hammering of Belarus yesterday in the Men’s Ice Hockey World Championship in Prague, I was curious about the stats of the players on the Canadian team. With their easy domination of last year’s host team, were they also dominating the stats of the 16-team tournament? I found that in some categories, they were — but what impressed me nearly as much as Canada’s scoring efficiency was the way the IIHF presents the statistics. Here’s why the IIHF stats rock!
Easy Peasy
Everything is easy to see, giving you the stats you want in easy-to-read blocks — so you don’t need to go hunting. The stats are divvied up into two main categories as you’d expect — Teams and Players — and the Players are then sub-divided into three categories, Rankings, Goalkeepers and Skaters.
Team Statistics
With Teams, the stats include ranking scoring efficiency, powerplay, penalty killing, penalties, goalkeeping — and attendance (which the host country, Czech Republic, has posted an all-time attendance record with 6 games left to play). A legend explaining the acronyms used like DVG (Disadvantage) and TPP (Time of Powerplay) is available on the page to clearly spell out all the column headings for each category. Nice!
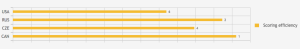
What’s really trick, though, is how you can then compare the different categories by matching which ever teams you want. The screenshot below is a comparison I made of the scoring efficiency of the four teams that will be playing in the semi-finals tomorrow: Canada, Czech Republic, Russia and USA.
Player Statistics
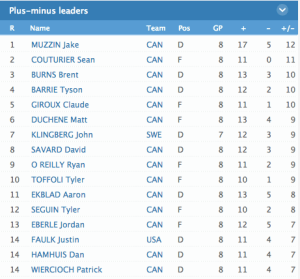
With the Players Statistics, there’s even more to be had, with blocks that cover the stats you’d expect to see, like scoring leaders, goal leaders, assist leaders — but some others that you wouldn’t necessarily expect to see, like plus/minus leaders and defencemen scoring leaders. You can also see who’s been penalized the most and who the face-off leaders are.
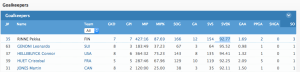
Both Goalkeepers and Skaters can be filtered by country, and Skaters can be filtered by Defence or Forward. The results can be sorted by column, so if you’re looking for the top goaltender in terms of shutouts, you’ll find that Nashville Predators Pekka Rinne, who was playing for Finland, ranks first, with three. Although Finland is now out of the tournament after yesterday’s 5-3 loss to Czech Republic, Rinne’s number one position of having the most shutouts will not be surpassed with the remaining teams having a maximum of two games left to play, and Rinne’s closest competitors of Connor Hellebuyck (USA), Martin Jones (CAN), Ondrej Pavelec (CZE) and Mike Smith (CAN) have only logged one shut out each.
The only thing that is a bit unusual is that for goalkeepers, their Save Percentage isn’t written as a decimal, but as a percentage. So Pekka Rinne’s SVS% (Saves as a Percentage of Shots on Goal) is 92.77.
Great Resource
There’s also a listing of IIHF Official Documents available for download, if you want to pour over the information yourself. If I have any complaints, it’s that all the results are limited to a maximum of 20, and I would like to be able to expand those lists to see all the players — which I’d also want the ability to resort via position — as well as a listing of all goalkeepers. In any event, hats off to the IIHF for finding a way to present the statistics in a way that certainly helps people understand the stats better, making it easy for the hockey aficionados, journalists and coaches using the site.