After the Detroit Red Wings bested the defending champion Tampa Bay Lightning 1-0 earlier this month, coach Jeff Blashill had high praise for his young team.
“We are a much better hockey team this year than we were a year ago,” Blashill noted. (from ‘Detroit Red Wings stave off Lightning, 1-0 in shootout, top last season’s win total’ – Detroit Free Press – 5/1/20)
He’s right. The Red Wings are a better team this year. But how much have they grown?
Similar to a product or business unit, we can quantify Detroit’s progress with year-over-year analysis, using last year’s team for comparison. We’ll do just that – first covering high-level metrics, then diving deeper into the offensive and defensive aspects of the Red Wings’ game.
2020-21 Red Wings vs. 2019-20 Red Wings
At the highest level, here’s how this year’s team compared with last year’s rock bottom-dwelling squad:
| Metric | 2019-20 Red Wings | 2020-21 Red Wings | Net Difference |
| Points % | 0.275 | 0.429 | 56.00% |
| GF/GP | 2.00 | 2.23 | 11.50% |
| GA/GP | 3.73 | 3.00 | -19.57% |
| PP% | 14.9% | 11.4% | -23.49% |
| SH% | 74.3% | 78.7% | 5.92% |
Except for the power play, the Red Wings improved in all high-level categories. Most notably, Detroit produced 56 percent growth in Points % – they won more games in fewer opportunities this season.
In addition, their goals-against is trending in the right direction, with a 19.57 percent decrease in goals allowed per game. More on team defense later.
Finally, while their offense did not show much improvement, it’s noteworthy that the Red Wings did, in fact, see some growth in the goal-scoring department. It’s noteworthy because several players missed significant time this season, meaning Detroit’s depth had to step up – and they did to some extent.
With that being said, let’s take a closer look at Detroit’s offensive production over the past two years.
Red Wings Offense: Year-Over-Year Comparison
Look, it’s no secret the Red Wings struggled to score this year. I’ll let the numbers do the talking, then provide some context after.
| Metric | 2019-20 Red Wings | 2020-21 Red Wings | Net Difference |
| CF/60 | 47.72 | 46.33 | -2.91% |
| GF/60 | 1.63 | 1.91 | 17.18% |
| xGF/60 | 1.92 | 1.88 | -2.08% |
| HDCF/60 | 8.54 | 8.57 | 0.35% |
All statistics at five-on-five. Metric definitions are provided below.
Okay, so not great. Last year’s team was bad. Producing similar offensive numbers is not a good sign, but there is some context worth diving into.
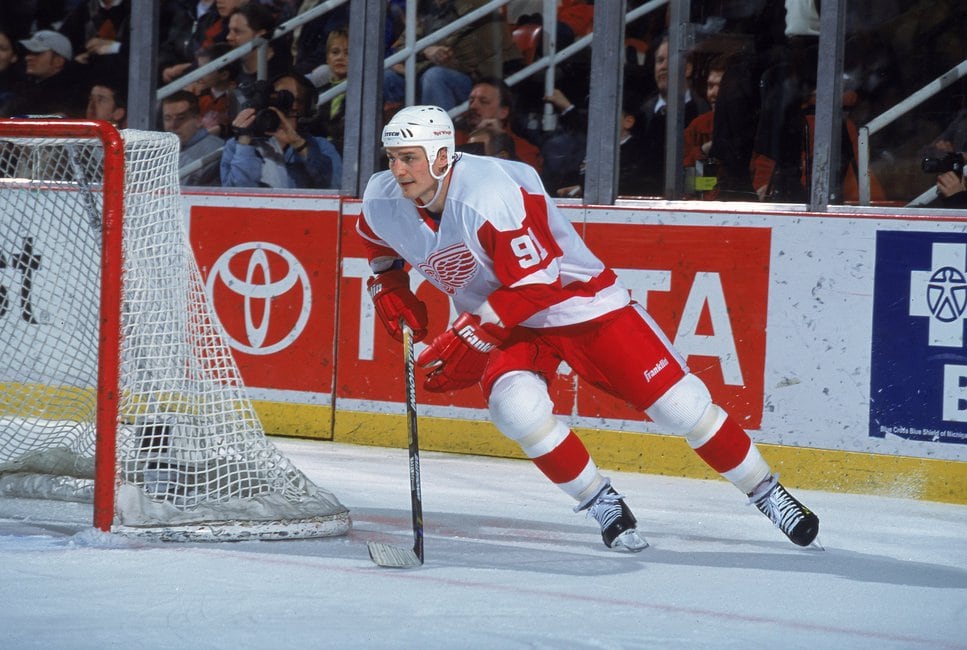
First, as I mentioned above, injuries happened. Tyler Bertuzzi missed all but nine games this season. Dylan Larkin, Robby Fabbri, and Bobby Ryan sat out significant chunks of the year, too. Those four—combined with Filip Zadina and the recently traded Anthony Mantha—were supposed to make up Detroit’s top six. No wonder offense was an issue.
In addition, the Red Wings have been putting more emphasis on playing an honest game.
“I think the biggest thing that we’ve gotta teach our guys is how to create offense while playing a 200-foot game. Way more important than how to create what I would call fake offense or cheating offense, because you can help with that and you’re just helping yourself lose.”
–Jeff Blashill (from ‘Bultman: Why the Red Wings emphasize two-way play and what it means for their young forwards’ – The Athletic – 4/29/21)
The overall commitment to strong team defense is great – more on that shortly. But it’s also possible that the Red Wings are still adapting to this style of play and haven’t figured out how to balance defensive awareness and create offense at the same time. Minimal practice time during the condensed season doesn’t help, either.
Besides, when they do score, the results are good. The Red Wings were 17-2-1 this season when scoring three or more goals in a game. Imagine if they were able to do this more than 20 times and maintain their defensive game plan.
Overall, the year-over-year offensive growth wasn’t great. But when you dig deeper, there’s valuable context.
Now, onto team defense.
Red Wings Defense: Year-Over-Year Comparison
The eye test suggests the Red Wings were better defensively this season. Using advanced analytics, we can quantify just how much they’ve improved since last season.
| Metric | 2019-20 Red Wings | 2020-21 Red Wings | Net Difference |
| CA/60 | 56.04 | 55.63 | -0.73% |
| GA/60 | 2.97 | 2.46 | -17.17% |
| xGA/60 | 2.40 | 2.26 | -5.83% |
| HDCA/60 | 10.87 | 9.96 | -8.37% |
All statistics at five-on-five. Metric definitions are provided below.
It’s remarkable that the Red Wings have improved in every category. In particular, their goals-against and expected goals-against growth numbers are outstanding. Not only have the Red Wings corrected their defensive woes, they’ve actually improved to the point that they’re outside the bottom ten teams for GA/60 and xGA/60 at five-on-five.
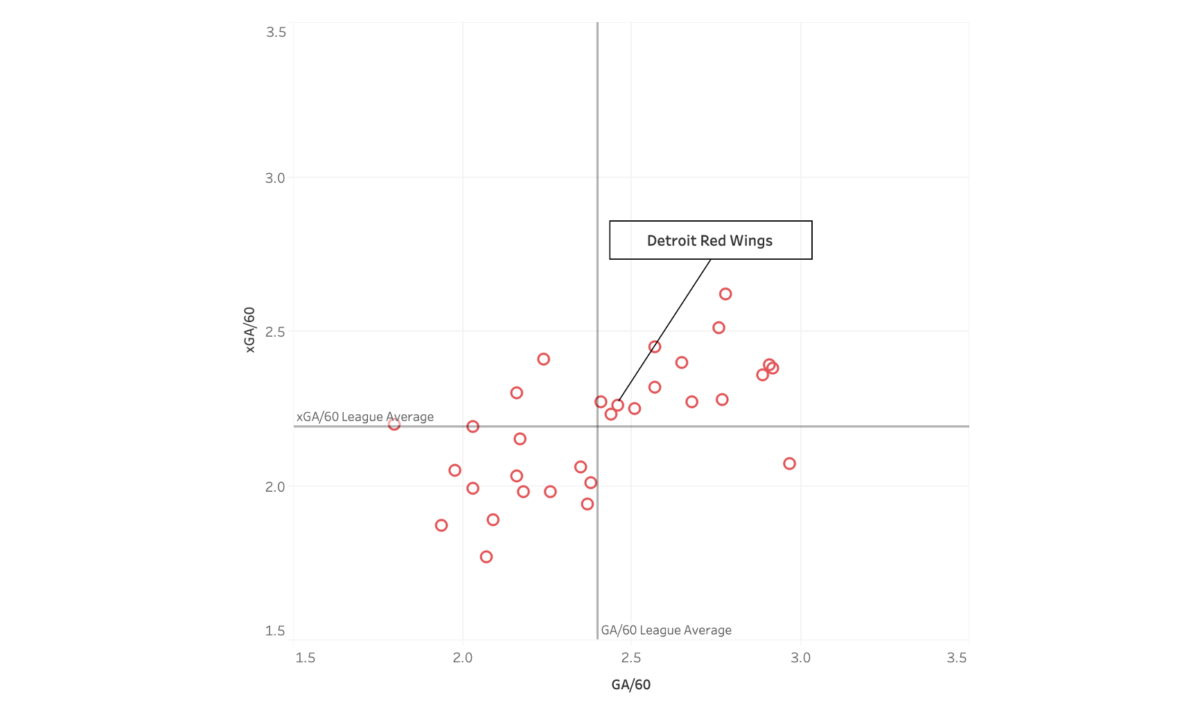
Blashill’s preference to play a conservative game and minimize opponents’ chances is the reason for this. Minus a couple instances, the Red Wings are no longer losing games by a wide margin.
“We’re a better defensive team,” Blashill said. “Large parts of the year we’ve had better moxie with the puck.”
A few of Steve Yzerman’s offseason additions were a big part of Detroit’s defensive growth, as evidenced by their defensive goals-above replacement numbers (DGAR):
- Vladislav Namestnikov: 2.2
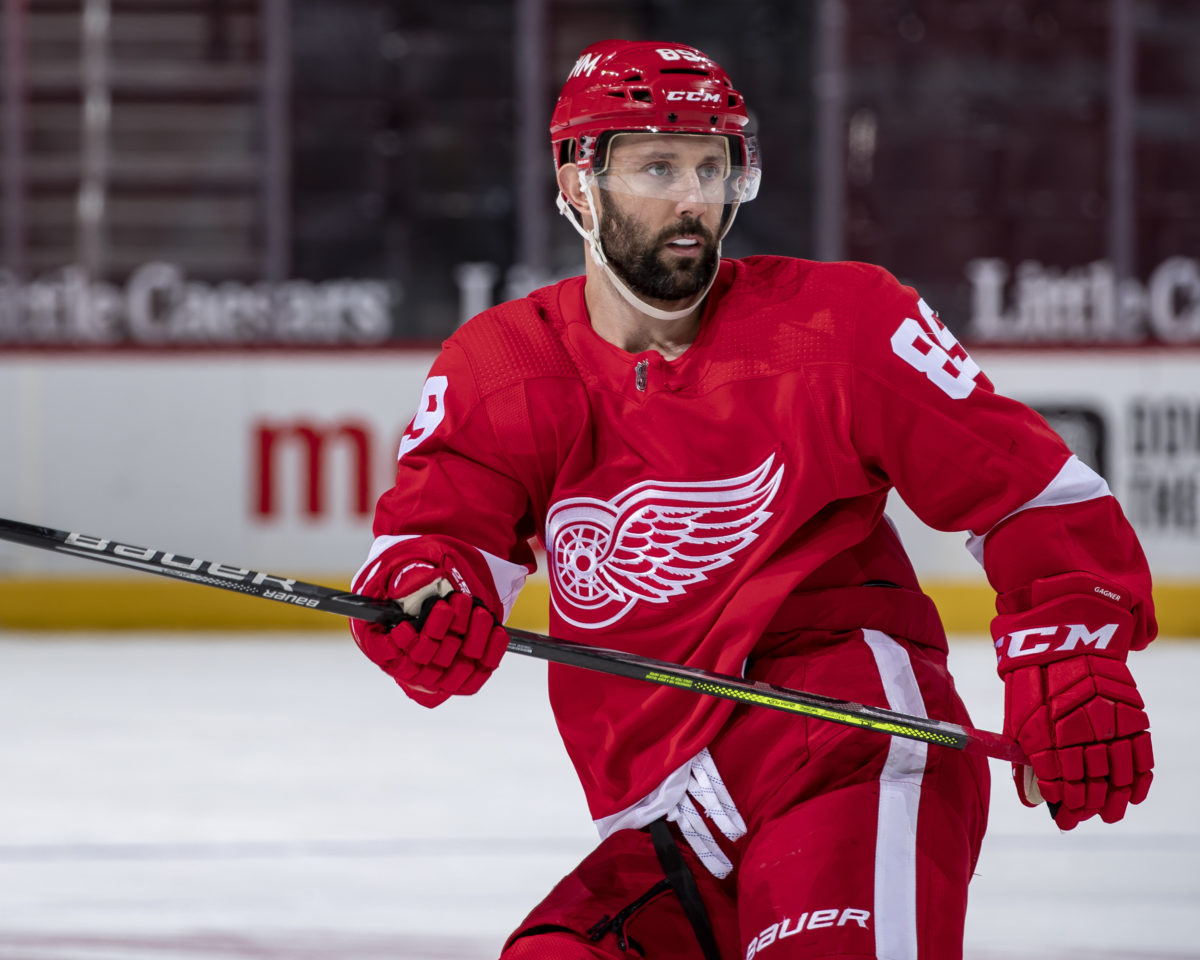
- Sam Gagner: 2.5
- Troy Stecher: 2.4
- Jon Merrill: 5.1
(Yes, Gagner was not an addition, per se. But bringing him back as a UFA last fall is good enough reason to include him in the list above.)
For comparison, Larkin’s DGAR was 0.1; Patrik Nemeth’s was 1.4. It may not have seemed like it at the time, but these players were savvy additions.
Apart from the newcomers, Zadina and Michael Rasmussen greatly improved their defensive game as well. Zadina, in particular, looked like Pavel Datsyuk at times with sneaky takeaways in the offensive zone and subsequently creating scoring chances after taking possession.
This overall defensive growth bodes well for the future. Not only does Detroit’s young core learn the defensive side of the game earlier in the rebuild, but it also prepares them for tight, shutdown play that we typically see during the postseason.
Final Word
Make no mistake – the Red Wings improved during the 2020-21 season. Offensively, the growth was minimal. But defensively, there was substantial improvement.
Finally, the Red Wings are trending in the right direction. Their year-over-year numbers are clear evidence of this.
Advanced Metrics Definitions
Below are quick definitions of the metrics used to quantify improved defense:
- CF/60 & CA/60 – Corsi-for/against per 60. Shots on net, missed shots, and blocked shots per 60 minutes of five-on-five play.
- GF/60 & GA/60 – Goals-for/against per 60.
- xGF/60 & xGA/60 – Expected goals-for/against per 60 – according to Natural Stat Trick’s shot location model.
- HDCF/60 & HDCA/60 – High-danger chances for/against per 60 – per Natural Stat Trick’s shot location data.
- DGAR – The defense component in Evolving-Hockey’s Goals Above Replacement model.
Stats courtesy of NHL.com, Natural Stat Trick, and Evolving-Hockey.
Free Newsletter
Get Detroit Red Wings coverage delivered to your inbox
In-depth analysis, breaking news, and insider takes - free.
Subscribe Free →