
“Do advanced stats Lead to Playoff Success?”
This is the question that so many people love to argue about. Regardless of your opinion on the advanced stats “revolution” odds are your opinion is correct in some way. The reason is because statistics such as Corsi, Fenwick and PDO have both predicted successful teams and mistakenly overvalued unsuccessful teams. Here are a few examples.
- 2010 Toronto Maple Leafs. Ranked 3rd in Corsi. 3rd in Fenwick. 28th in PDO. Missed playoffs.
- 2011 Boston Bruins. Ranked 14th in Corsi. 16th in Fenwick. 1st in PDO. Won Stanley Cup.
- 2012 Los Angeles Kings. Ranked 2nd in Corsi. 4th in Fenwick. 28th in PDO. Won Stanley Cup.
- 2013 New Jersey Devils. Ranked 2nd in Corsi. 1st in Fenwick. 28th in PDO. Missed playoffs.
Essentially advanced statistics would on a basic scale suggest that all of these teams should have succeeded to some extent, yet the results are drastically different. Overall, there is no sure-fire way to win a Stanley Cup because it requires numerous things that go beyond the stat column. Other than being a good team, players need to be consistent at the right time, have acceptable special teams and hopefully get clutch performances out of players who were going unnoticed. Still, there are some definite trends that both basic statistics and advanced statistics have picked up on since the 2005 lockout. With this in mind let us take a look at the top rated teams in various categories from the past nine years and compare their performances through the playoffs.
A big thank you goes out to War-on-ice.com for this data.
Corsi
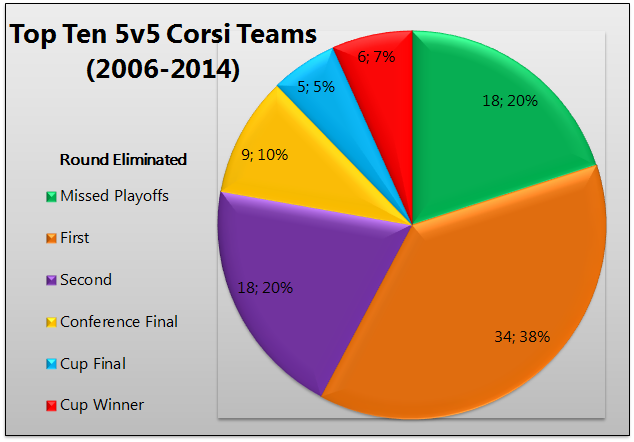
- Corsi Number= (Shots on Net For + Missed Shots For + Blocked Shots Against) – (Shots on Net Against + Missed Shots Against + Blocked Shots For.)
- Typically used for 5v5 situations.
There have been nine Stanley Cup winners since 2006 and six of them have finished within the top ten in 5v5 Corsi. Eleven of the eighteen teams to reach the final during that time have also finished among the top ten which clearly shows that out-shooting your opponent is an important aspect of the game. Unfortunately, Corsi is just that, a shot counter, and while shots correlate with goals they do not correlate equally. Teams and players will always have different scoring percentages and paces. Of the 90 teams to finish within the top ten in Corsi over the past nine seasons twenty percent have missed the playoffs, a rather large amount. However, teams who out-shoot their opponents via Corsi or Fenwick are far more likely to qualify for the playoffs and tend to perform better in the playoffs.
Goal Differential

By comparison, 5v5 goal differential has been a better predictor of playoff success across the board. Only five teams have missed the playoffs who have finished within the top ten. More teams make the playoffs and succeed in each round because of their ability to put the puck in the net, rather than just generate shots. On top of that thirteen of the past eighteen Stanley Cup finalists have been among the top ten in 5v5 goals. While this is a good indicator of success for NHL teams going into the playoffs total goal differential is an even better indicator!
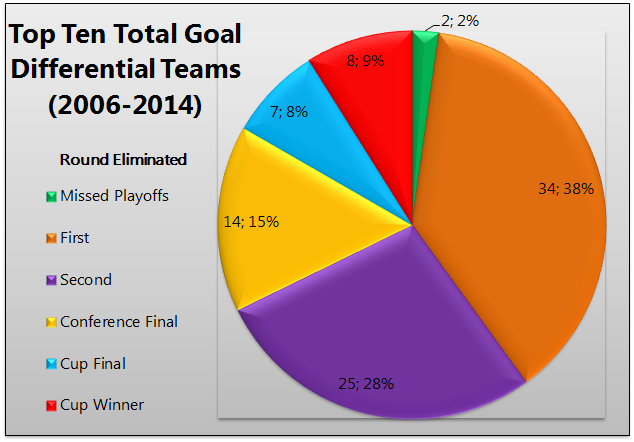
Since 2006, only two teams (2008 Buffalo Sabres, 2009 Minnesota Wild) have missed the playoffs while finishing within the top ten in total goal differential. Only three teams (2006 Edmonton Oilers, 2006 Carolina Hurricanes, 2012 New Jersey Devils) were not among the top ten in goals scored and made it to the Stanley Cup Final. The biggest reason why total goal differential has been one of the best predictors for playoff success is because it includes special team play.
What many pioneers of advanced stats tend to forget is that on average there are 3.3 penalties called against each team per game fora total of 6-7 penalties and 12-14 minutes. That is a lot of time per game that is not spent being played 5v5. Even if we knock this number down due to power play goals being scored there is still a good chance that over ten minutes each game are spent 5v4, 4v4 or 5v3. That means roughly 20% of each NHL game is NOT played at 5v5. Special teams can make all the difference come playoff time, which is why total goal differential has been shown to predict playoff success so well. That is why a mere 2% of teams have only missed the playoffs among the top ten in total goal differential compared to 20% in Corsi.
Personally, I have always been a much larger proponent of goal differential. The reason is because games are won directly with goals. Fights, face-offs, goal-tending, hits, passes, and shots are all indirect victories that eventually lead to goals but none of them directly lead to wins. While goals are indeed direct results of shots they rely on the final result not the statistic itself. A team with four goals on 14 shots still wins over a team with two goals on 50 shots. Coincidentally, teams who generate more shots than their opponents but have lower than average shooting percentages may change their luck during the playoffs. At the same time it teams who have aboven ormal shooting percentages may fall back to Earth come playoff time. This is where the importance of PDO comes into play.
PDO
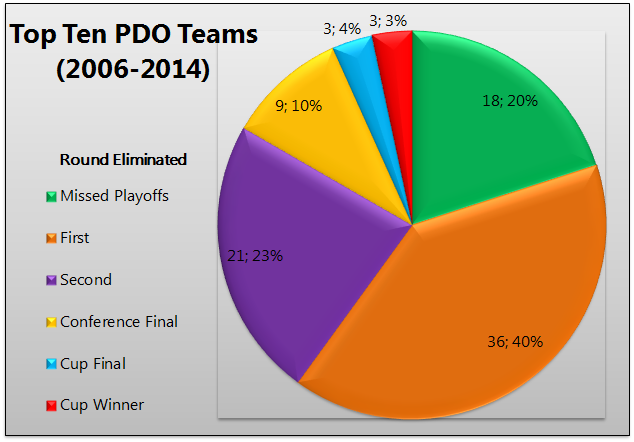
- PDO= (Save Percentage x 100) + Shooting Percentage. Average/ Normal is 100
- Example: Team Save Percentage .920 and Team Shooting Percentage 8.7
- (.920 x 100) + 8.7 = 100.7
To put it simply a team can be among Corsi and Fenwick leaders year after year but if they fail to put the puck in the net their PDO rating will suffer. At the same time a team can be among the leaders in goal differential but if their PDO rating is higher than average they may be primed to fail. Let me explain, high shooting percentages rarely stay constant. A team that is outscoring their opponents dramatically regardless of shot differences wants to hover around a PDO of 100. This is why teams who rank among the top ten in PDO are far more likely to lose in the early rounds of the playoffs and miss the playoffs. Last season the Montreal Canadiens were the only team to make it past the second round while finishing in the top ten in 5v5 PDO.
Only once since the 2005 lockout have three of the top ten PDO teams made it past the second round during the same playoff. It occurred in 2007 and despite three of the final four teams being among the highest PDO ranked teams none won the Stanley Cup. Instead it went to the Anaheim Ducks who were ranked 12th. PDO is perhaps one of the most overlooked statistics in hockey today and I am unsure why. The stat views what teams are truly over-performing based on their shooting and save percentages. It is no coincidence that it is the least accurate predictor of success by comparison. Instead PDO is a much better indicator of possible failure.

While goal differential may be the best indicator it still is not a guarantee for success. A few Stanley Cup winning teams in recent history have bucked the trend not just for Corsi but PDO and goal differential. Perhaps the biggest takeaway from this is that nearly all Cup winners since 2005 have been among the top ten in total and 5v5 goal differential and the top five in Corsi. Even the best of the best have outliers and contradictions which is why some things just can not be measured.
| Rank | |||||
| Team | 5v5 Corsi | 5v5 Goal Differential | Total Goal Differential | PDO | |
| 2006 | Carolina Hurricanes | 24 | 14 | 11 | 14 |
| 2007 | Anaheim Ducks | 4 | 8 | 6 | 12 |
| 2008 | Detroit Red Wings | 1 | 1 | 1 | 16 |
| 2009 | Pittsburgh Penguins | 19 | 5 | 9 | 3 |
| 2010 | Chicago Blackhawks | 1 | 3 | 2 | 26 |
| 2011 | Boston Bruins | 17 | 1 | 2 | 1 |
| 2012 | Los Angeles Kings | 2 | 16 | 9 | 28 |
| 2013 | Chicago Blackhawks | 4 | 1 | 1 | 3 |
| 2014 | Los Angeles Kings | 1 | 4 | 7 | 15 |
Revelations and Recipes
The biggest thing to take away from this is that good teams are likely to be statistically sound across the board. If we had Corsi statistics from fifty years ago, odds are they would lean towards the more successful teams. Winners both during the regular season and the playoffs usually out-shoot and outscore their opponents but it doesn’t end there. Face-offs, special teams and even hits are likely to be above average as well. The advanced stats “revolution” truly isn’t a revolution as it is a revelation. It is an in-depth look at why teams are better than other teams and why they tend to succeed beyond a basic eye test. Having more statistics to look at is comparable to reading numerous reviews about a restaurant and getting an in-depth idea of what to expect. But in the end there is no way to find out the truth until you actually go there, usually more than once.
Here is a metaphor that I enjoy using when referring to statistics;
You enter a sports bar and order a pizza. But you are hungry and with numerous friends so a pizza by itself will not satiate your appetite. You decide to order some appetizers such as wings, bread-sticks and cheese-fries. While this quells your hunger you need something smooth to wash it down. You decide to order a few pitchers of beer (or soda) for yourself and your friends. In the end you leave feeling satisfied with a complete meal. Don’t get it? Well here is a simple breakdown.
- The pizza is Corsi, a large and well-rounded statistic.
- The appetizers are other advanced stats that are deep in flavor. Zone entries, Zone starts, PDO and Fenwick.
- The beverages are simple statistics that go down smooth. Points, Goal differential, Ice time, and Face-offs.
Alone they don’t make for much of a meal, but together they compliment each other and create a delicacy. These are the ingredients for the Stanley Cup. Unfortunately it is not enough. No one truly knows the proper measurements or baking instructions but whomever wins this competition of “Cooking with Corsi” will be holding the Stanley Cup next summer.
Free Newsletter
Get Advanced Stats coverage delivered to your inbox
In-depth analysis, breaking news, and insider takes - free.
Subscribe Free →


