- The 16 Playoff Teams
- 2018 Stanley Cup – Betting Odds
- Heavy Favorites
- Middle of the Pack
- Long Shots
- Chances of Winning the 2018 Stanley Cup
- 2017-18 Special Teams Play
- Power Play Conversion
- Penalty Killing Conversion
- 2017-18 Goal Scoring
- Best Win Percentage in One-Goal Games
- Goals For (5-on-5)
- Goals For (Total)
- Goals Against (Total)
- Goal Differential
The regular season is complete. The 16-team playoff table has now been set. The Stanley Cup playoffs kick off Wednesday, Apr. 11. It’s the best two months in all of sport, where every shift, every check and every play matters. It’s when real players perform their best, wins make players forget about pain and heroes are born.
The 16 Playoff Teams
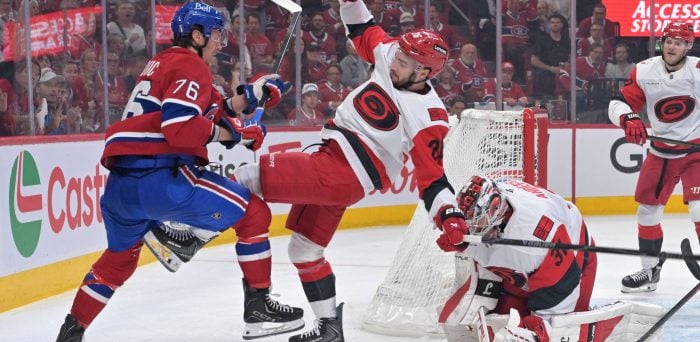
In the Eastern Conference, the Tampa Bay Lightning, Boston Bruins, Washington Capitals, Toronto Maple Leafs, Pittsburgh Penguins, Philadelphia Flyers, Columbus Blue Jackets and New Jersey Devils are all in it.
In the Western Conference, the Nashville Predators, Winnipeg Jets, Vegas Golden Knights, Minnesota Wild, Anaheim Ducks, San Jose Sharks, Los Angeles Kings and Colorado Avalanche all advanced.
The hottest teams entering the playoffs are the Jets (9-1-0), Ducks (8-1-1), Capitals (8-2-0) and Devils (7-2-1). The coldest teams entering the playoffs are the Avs (4-5-1) and the Wild (4-2-4). Both the Golden Knights and Blue Jackets finished the regular season on a two-game losing skids.
The stage is set.
Let's do this. pic.twitter.com/hravmzaKhx
— NHL on NBC Sports (@NHLonNBCSports) April 9, 2018
2018 Stanley Cup – Betting Odds
As of Apr. 3, these are the betting odds to win the 2018 Stanley Cup according to BetOnline Sportsbook.
The number represents how much a $100 bet would yield if the team won the Stanley Cup. For example, a $100 bet on the heavily-favored Predators would return $350; a $100 bet on the Devils would fetch a healthy $4,000 return.
Heavy Favorites
Nashville Predators (+350)
The Preds are fresh off winning their first Presidents’ Trophy in franchise history. They have balance and depth throughout their lineup. They had thirteen 10-goal scorers this season. Smashville can’t wait to get the party going again.

Tampa Bay Lightning (+575)
This year, Nikita Kutcherov hit the 100-point mark while winger Yanni Gourde set a franchise rookie record for goals (25) and points (64). Of all the teams to qualify for the postseason, the Lightning have the worst penalty-killing percentage (76.1 percent). They had eleven 10-goal scorers this season. With battle-tested New York Rangers Ryan McDonagh and J.T. Miller added at the deadline, the Lightning are a heavy favorite.
Boston Bruins (+625)
The Bruins have 11 players with ten or more goals and three that reached 30 – Brad Marchand (34), David Pastrnak (34) and Patrice Bergeron (30). They made some big moves at the trade deadline, adding Rick Nash, Brian Gionta, Nick Holden and Tommy Wingels.
Vegas Golden Knights (+700)
This team that only existed on paper a year ago has shattered expansion-team records. Center William Karlsson leads the team’s offense with 43 goals and 35 assists. In net, Marc-Andre Fleury gives his team a chance every night.

Pittsburgh Penguins (+850)
The back-to-back, defending Stanley Cup Champions are hard to count out. They score. A lot. The Pens have the league’s best power play, scoring 68 goals and converting on 26.2% of their chances. They’ll try to be the first team to three-peat since the New York Islanders won four in a row from 1980-83.
Middle of the Pack
Winnipeg Jets (+1000)
The Jets, led by Blake Wheeler and sniper Patrik Laine, have yet to win a playoff game in their second reincarnation. They’re one of two Canadian teams to make the postseason and hold the nation’s best shot at ending their 25-year Stanley Cup drought.
Toronto Maple Leafs (+1400)
The Leafs have the second-best power play (25% conversion). They score a lot of goals, boasting three players with 30-plus goals – Auston Matthews (34), Nazem Kadri (32) and James van Riemsdyk (36).
Washington Capitals (+1600)
Will this be the year Alex Ovechkin and the Caps make it past the second round? Ovi ran away with the NHL goal-scoring title this year, finishing with 49, four more than Patrik Laine of the Jets. It’s the ninth time he’s topped 40 goals in a season. The Caps had 11 ten-goal scorers this season.
San Jose Sharks (+2200)
Former-Sabres winger Evander Kane finally gets his chance to appear in the playoffs. He’s given some new life to the Sharks who finished 11-4-1 down the stretch. In the last three seasons, Brent Burns leads all defensemen in points (213). The Sharks are the League’s second-best penalty killers (84.8 percent). The Sharks had 11 ten-goal scorers this season.
Los Angeles Kings (+2500)
The Kings finished the season winning five of six and 10 of 15. Their offense is led by Anze Kopitar (35 goals), Dustin Brown (28 goals) and Tyler Toffoli (24 goals). The Kings own the league’s best penalty kill at 85 percent.

Anaheim Ducks (+2500)
Of all 16 playoff teams, the Ducks scored the fewest number of goals. They had the fourth lowest goal differential (plus-19) and the second-worst power play conversion rate (17.8) of all teams that qualified for the playoffs.
Long Shots
Minnesota Wild (+2800)
While the resurgence of Eric Staal (42 goals, 34 assists) has been a breath of fresh air for the Wild. Defenseman Ryan Suter’s ankle injury certainly sucked some life out of the Wild’s chances. It’ll take some stellar goaltending for them to go deep.
Columbus Blue Jackets (+2800)
The Blue Jackets had ten 10-goal scorers this season. Artemi Panarin, aka “The Bread Man” leads the offense with 27 goals and 55 assists. They have the worst power play among all playoff teams, converting on just 17.2 percent of their chances.
Colorado Avalanche (+2800)
The Avs snuck into the postseason, grabbing the last spot by defeating the St. Louis Blues in what felt like an elimination playoff game. At times, they look unstoppable. Other times, they make one scratch their head. Which team will show up?
Philadelphia Flyers (+3300)
This year, Claude Giroux put up a career-high 99 points. He always comes ready to shine in the playoffs. Giroux is one of eleven 10-goal scorers on the Flyers this season. The Flyers goaltending has been questionable and will likely prove to be their Achilles heel.
New Jersey Devils (+4000)
Taylor Hall will lead the turnaround Devils back to the dance. The team had ten 10-goal scorers this season, but is at the bottom of the goal differential stats (plus-four) among all playoff teams.
Chances of Winning the 2018 Stanley Cup
The following lists each team’s chance of winning the Stanley Cup according to SportsClubStats.com as of Sunday, Apr. 8.
- Nashville Predators 15.5%
- Boston Bruins 16.4%
- Winnipeg Jets 12.8%
- Tampa Bay Lightning 12.3%
- Vegas Golden Knights 8.3%
- Los Angeles Kings 5.4%
- Toronto Maple Leafs 5.3%
- Pittsburgh Penguins 4.1%
- Washington Capitals 4.0%
- Anaheim Ducks 3.4%
- Philadelphia Flyers 2.7%
- San Jose Sharks 2.7%
- Columbus Blue Jackets 2.3%
- Minnesota Wild 2.2%
- Colorado Avalanche 2.0%
- New Jersey Devils 1.0%
The following lists each team’s chance of winning the Stanley Cup according to moneypuck.com as of Sunday, Apr. 8.
- Winnipeg Jets 13.7%
- Boston Bruins 11.9%
- Tampa Bay Lightning 10.7%
- Nashville Predators 9.9%
- Pittsburgh Penguins 7.5%
- San Jose Sharks 7.4%
- Columbus Blue Jackets 6.4%
- Toronto Maple Leafs 6.2%
- Minnesota Wild 4.8%
- Anaheim Ducks 4.4%
- Vegas Golden Knights 3.8%
- Los Angeles Kings 3.4%
- Philadelphia Flyers 3.1%
- Colorado Avalanche 2.5%
- Washington Capitals 2.1%
- New Jersey Devils 2.1%
2017-18 Special Teams Play
A strong power play can be very helpful during the regular season. However, in the playoffs, the man advantage isn’t as indicative of success. In the 2017 playoffs, eight of the top 11 power play teams lost in the first round. Winning the 5-on-5 battle is much more important.
The suggestion that referees swallow their whistles is a myth. Through three rounds of the playoffs last season, power-play opportunities were up to 6.22 per game from 5.97 during the regular season. And power play goals were less frequent.
Power Play Conversion
- Pittsburgh Penguins 26.2%
- Toronto Maple Leafs 25.0%
- Tampa Bay Lightning 23.9%
- Boston Bruins 23.5%
- Winnipeg Jets 23.4%
- Washington Capitals 22.5%
- Colorado Avalanche 22.0%
- New Jersey Devils 21.4%
- Vegas Golden Knights 21.4%
- Nashville Predators 21.2%
- Philadelphia Flyers 20.7%
- San Jose Sharks 20.6%
- Los Angeles Kings 20.4%
- Minnesota Wild 20.4%
- Anaheim Ducks 17.8%
- Columbus Blue Jackets 17.2%
Penalty Killing Conversion
- Los Angeles Kings 85.0%
- San Jose Sharks 84.8%
- Boston Bruins 83.5%
- Colorado Avalanche 83.3%
- Anaheim Ducks 83.2%
- Nashville Predators 81.9%
- New Jersey Devils 81.8%
- Winnipeg Jets 81.8%
- Toronto Maple Leafs 81.4%
- Vegas Golden Knights 81.4%
- Minnesota Wild 81.3%
- Washington Capitals 80.3%
- Pittsburgh Penguins 80.0%
- Columbus Blue Jackets 76.2%
- Tampa Bay Lightning 76.1%
- Philadelphia Flyers 75.8%

Guy Boucher, the Ottawa Senators’ coach last year, has a theory on why power plays are less successful in the playoffs. “It’s a lot easier to destroy something than it is to build something. Guys are so dedicated to defending. They’re in the lanes and blocking shots with a much higher percentage,” said Boucher. “The playoffs are about paying the price. They’re about desperation. And there’s a lot of that on penalty kills.”
2017-18 Goal Scoring
Regular season success is only an indicator for playoff success. That said, with goals in the playoffs at a premium, teams still need to find a way to score. Here are the team’s winning percentage in one-goal games, 5-on-5 goal scoring totals, overall goals for, goals against and goal differential for all 16 playoff-bound teams.
Best Win Percentage in One-Goal Games
- Tampa Bay Lightning .676%
- Toronto Maple Leafs .658%
- Columbus Blue Jackets .622%
- Nashville Predators .615%
- Winnipeg Jets .611%
- Washington Capitals .606%
- New Jersey Devils .595%
- Boston Bruins .583%
- Vegas Golden Knights .579%
- San Jose Sharks .563%
- Anaheim Ducks .514%
- Pittsburgh Penguins .513%
- Philadelphia Flyers .452%
- Minnesota Wild .444%
- Los Angeles Kings .424%
- Colorado Avalanche .423%
Goals For (5-on-5)
- Tampa Bay Lightning 196
- Toronto Maple Leafs 187
- Winnipeg Jets 176
- Vegas Golden Knights 176
- Washington Capitals 171
- Columbus Blue Jackets 169
- Nashville Predators 168
- Boston Bruins 165
- Pittsburgh Penguins 161
- New Jersey Devils 160
- Minnesota Wild 160
- San Jose Sharks 159
- Philadelphia Flyers 158
- Anaheim Ducks 157
- Los Angeles Kings 155
- Colorado Avalanche 152
Goals For (Total)
- Tampa Bay Lightning 296
- Winnipeg Jets 277
- Toronto Maple Leafs 277
- Vegas Golden Knights 272
- Pittsburgh Penguins 272
- Boston Bruins 270
- Nashville Predators 267
- Washington Capitals 259
- Colorado Avalanche 257
- Minnesota Wild 253
- San Jose Sharks 252
- Philadelphia Flyers 251
- New Jersey Devils 248
- Columbus Blue Jackets 242
- Los Angeles Kings 239
- Anaheim Ducks 235
Goals Against (Total)
- Los Angeles Kings 203
- Nashville Predators 211
- Boston Bruins 214
- Anaheim Ducks 216
- Winnipeg Jets 218
- Vegas Golden Knights 228
- San Jose Sharks 229
- Columbus Blue Jackets 230
- Toronto Maple Leafs 232
- Minnesota Wild 232
- Tampa Bay Lightning 236
- Colorado Avalanche 237
- Washington Capitals 239
- Philadelphia Flyers 243
- New Jersey Devils 244
- Pittsburgh Penguins 250
Goal Differential
- Tampa Bay Lightning +60
- Winnipeg Jets +59
- Boston Bruins +56
- Nashville Predators +56
- Toronto Maple Leafs +45
- Vegas Golden Knights +44
- Los Angeles Kings +36
- San Jose Sharks +23
- Pittsburgh Penguins +22
- Minnesota Wild +21
- Washington Capitals +20
- Colorado Avalanche +20
- Anaheim Ducks +19
- Columbus Blue Jackets +12
- Philadelphia Flyers +8
- New Jersey Devils +4
Free Newsletter
Get Previews and Predictions coverage delivered to your inbox
In-depth analysis, breaking news, and insider takes - free.
Subscribe Free →