Goalies are bizarre creatures. Their peculiar rituals include Patrick Roy talking to his goal posts and Glenn Hall making himself sick before every game. Regardless of the actual impact of said superstitions, both netminders are among the best at the position and are in the Hockey Hall of Fame. These superstitions helped to keep Roy and Hall’s minds sharp and keep themselves at the top of their games.
With how brief a goalie’s peak is, they will pursue any method to stretch their playing career by even one more season. Additionally, with just 62 roster spots available, the goaltender is the rarest position so maintaining peak performance is vital for an individual goalie.
Understanding the Aging Curve
For several years, peak age for skaters was traditionally thought to be between 25 and 28 but findings by Hockey-Graphs show this isn’t the case. Using WAR, it was determined that defensemen peak at 22 and are in their primes until 24 then steadily decline as they age.
There was a random spike in production at age 39 but was followed by a drastic regression. Meanwhile, forwards peak at 25 and their production plateaus from 21 to 29 with a much more gradual of a decline than originally thought. Their first significant regression didn’t occur until between the ages of 34 and 35.
For goaltenders, Hockey-Graphs once again provides the best model. The research looked at a time period between the 1996-97 and 2013-14 seasons and included only goaltenders who had played at least 20 years in the league. The findings were also adjusted to the league’s average save percentage (SV%) each season. Their research conveyed that goaltenders tend to have a steady decline in SV% after their age-24 season.
The research also found that the only time period in which a goalie improves his SV% is between the ages of 18 and 21 and plateaus until 24 when regression starts. This regression is still relatively small with only a decline of one or two percentage points year-to-year. It is not until age 32 when a significant decline starts and by 35, a goalie’s performance begins to fall off a cliff. Of course, there are the rare instances like Dominik Hasek, Martin Brodeur, and Roy who were all productive into their late 30’s.
Disregarding outliers like the three above, a goaltender with a .920 SV% at 35 will have a .907 SV% at 37 and be just an .885 goalie at 40. The general takeaway is that beginning at a young age, goaltenders progressively worsen over the course of their careers. However, like Hasek, Brodeur, and Roy, occasionally goaltenders will experience a spike in performance late in their careers. That is what is happening this season with Roberto Luongo, Pekka Rinne, and Marc-Andre Fleury.
Roberto Luongo Excelling in His 18th Season
At 38, Florida Panthers netminder Roberto Luongo has an extensive list of successes in the league. He is fourth all-time in wins with 468 and has been one of the best at his position throughout his career while playing on some poor Panthers teams. Although he has never won a Vezina Trophy, he has finished in the top five on four occasions, including a second place finish in 2007 when he lost to Brodeur. Luongo’s best performance was during the 2003-04 season when he was 24. That season he finished third in Vezina voting behind Brodeur and Mikka Kiprusoff.
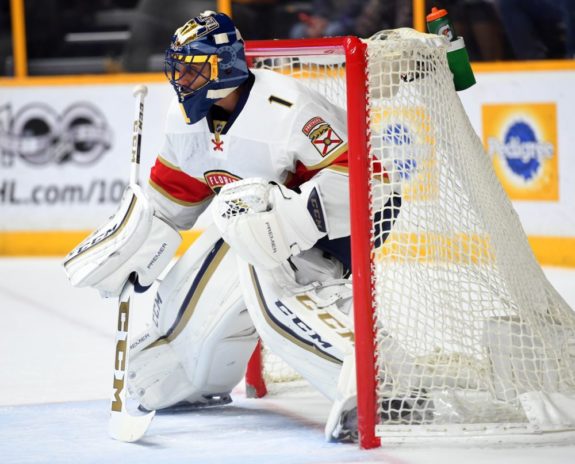
In 2003-04, Luongo appeared in 72 games and led the league in shots faced and saves made. He also had a .931 SV% and a 2.43 goals against average (GAA) and faced 34.4 shots per game. Luongo also had a league-leading 48.42 goals saved above average (GSAA), a metric that compares a goalie’s performance with that of the league average. He finished with a 25-33-14 record playing on a Panthers team that only scored 188 goals.
The 2010-11 campaign was another great season for Luongo. Playing with the Vancouver Canucks, he started 60 games, led the league with 38 wins, and had a .928 SV% and 2.11 GAA while facing 29.2 shots per game. He also had a .667 quality start percentage (QS%) and a 26.71 GSAA. This season, Luongo has made 29 starts as a result of early season injuries. That freshness has paid off, though, with a 2.55 GAA and a .927 SV%, his highest since the 2010-11 season, while facing 34.1 shots per start. His .655 QS% and 14.36 GSAA are both his highest since the 2010-11 season.
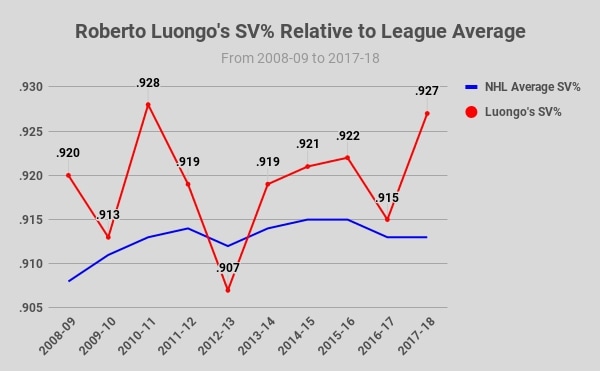
Broken down by quality of shots faced, Luongo is turning in one of his best performances. Against low-danger chances, he has a .980 SV% compared to a .981 SV% in 2010-11. Between the 2007-08 season, the first in which the stat was calculated and last season, he averaged a .981 SV% against low-danger shots.
Upping the difficulty, Luongo has a .937 SV% against medium-danger shots when he averaged a .927 SV% prior this season. During the 2010-11 season, he had a .945 SV% against these shots. Finally, against high-danger shots, he has an .815 SV% this season, significantly higher than his .784 SV% in 2010-11 or the .781 SV% he averaged between 2007-08 and last season.
Pekka Rinne Overcoming His Playoff Woes
The accolades for Nashville Predators goaltender Pekka Rinne continue to roll in this season. On Feb. 22, he joined the 300-win club and also surpassed the 50 shutout mark, becoming the 28th goaltender in league history to accomplish both. He has 40 wins for the third time in his career, the seventh goalie with that many instances. Additionally, if he wins three more games he will tie his own franchise record for wins in a season.
In his 10 full seasons, all with the Predators, Rinne has broken every goalie record for the franchise. He has consistently had regular season success with three top-five Vezina finishes including two second places, in 2010-11 and 2014-15. In 2010-11, like Luongo, he lost out to Thomas and in 2014-15, he lost to Carey Price. Regular season success aside, it is Rinne’s playoff numbers that are questionable, finishing with a sub-.910 SV% on three occasions.
On the surface, he was excellent in last year’s playoffs, guiding the Predators to the Stanley Cup Final. He led playoff goaltenders with 22 starts and 14 wins to go along with a .930 SV% and 1.96 GAA. Underneath the surface is a different story. In the Final, he had a .910 SV% in six games, still respectable. The issue was that Rinne was abysmal on the road, finishing all three road games in the Final with a sub-.850 SV%. Had he been able to make a few more saves in Pittsburgh, the Predators likely would have won the Stanley Cup.
It is evident that he took his struggles in the Final and applied a new dedication to his game this season. He has made 55 starts with a 40-11-4 record and a league-leading and career-best eight shutouts. He has a .928 SV%, his highest since 2010-11, and a 2.27 GAA, his best since the 2014-15 campaign and third-lowest of his career. His .673 QS% is a career high and he has a league-best 27.33 GSAA, second-highest of his career.
He also has a career-best .939 even strength SV% and an .876 SV% while shorthanded that is his highest in five seasons. By comparison, in 2010-11, his best season, he had a 33-22-9 record in 64 starts with a .930 SV% and a 2.12 GAA.
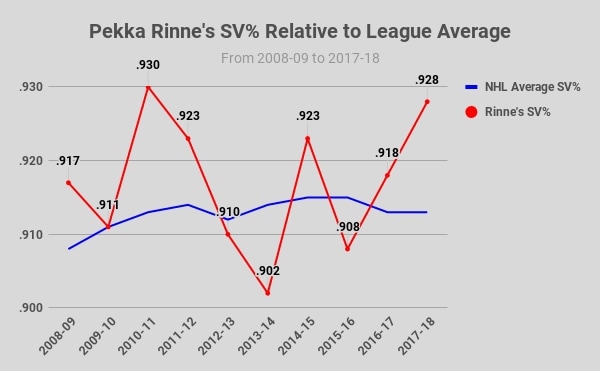
In terms of shot quality faced, Rinne’s .976 SV% against low-danger chances is lower than his 2010-11, 2014-15, and career marks. His .928 medium-danger SV% is lower than his 2010-11 and 2014-15 percentages but higher than his .923 career average. It is against high-danger chances where he has been most dominant. This season, he has an .840 SV% against high-danger shots. In 2010-11, he had an .805 SV% and in 2014-15, his SV% was .773. From 2007-08 through last season, he averaged a .745 SV% against high-danger chances.
Part of the reason for his remarkable season at age 35 are the technique changes he made this season. At six-foot, five inches, Rinne is one of the tallest goaltenders in the league and is using his size more to his advantage than ever before. He changed his stance to be more upright, allowing his sight-line to be clearer. He also moved back in the crease and is playing less aggressive than before.
This has allowed him to get to more pucks in a composed manner and has resulted in fewer sprawling, highlight reel saves. Lastly, is playing more inside the goalposts, allowing him to push-off and get to the other post easier.
The result has been Rinne jumping out as a Vezina Trophy favorite this season. Already the best Finnish goaltender in history based on statistics, he has the chance to play his best hockey in the twilight of his career. His change in technique and more consistent play will be a driving factor behind the Predators reaching the Stanley Cup Final again this season and emerging victorious this time.
Fleury the Leader Vegas Needs
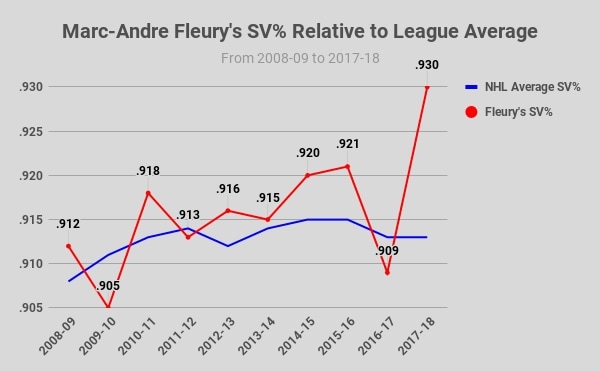
The Vegas Golden Knights selected Marc-Andre Fleury in last year’s Expansion Draft and people viewed him as the reason Vegas would be competitive this season. As it turned out, Fleury was injured in the fourth game and missed nearly two months, testing the team’s depth at the position. In 42 starts this season, Fleury has been lights out, with a .930 SV% and 2.15 GAA, both career-bests for the 33-year-old in his 14th season. He also has career-highs in GSAA at 22.62 and even strength SV% at .935. He also became the 13th goalie in league history to reach the 400-win mark.
Fleury has also been consistent this season, turning in a quality start 69 percent of the time, his highest rate. That consistency has not always been the case for Fleury as he has fluctuated from highs of a .921 SV% in 2015-16 and 2007-08 to a .909 SV% last season. In the playoffs he has been even more inconsistent. During the 2008 and 2009 playoffs when the Pittsburgh Penguins made consecutive Cup Final appearances, Fleury had GAA’s of 1.97 and 2.61, respectively.
In contrast, he also had playoff runs in 2012 and 2013 when his GAA’s were above 3.50 each year. During last year’s playoffs when he was pivotal in relief of Matt Murray, Fleury found his game once again, with a .924 SV% and 2.56 GAA in 15 games. Without him stepping up, the Penguins wouldn’t have won a second consecutive Stanley Cup.
This season, it appears as though Fleury is relieved to be the clear-cut starting netminder once again as he is turning in a better performance than when he was in his prime. Although he has never finished in the top-five in Vezina voting, he has put together some solid performances in his career. His best season came in 2014-15 when he was 30. That season, he started 64 games with a 34-20-9 record, a .920 SV%, 2.32 GAA, 10.28 GSAA, and had 10 shutouts.
Fleury has also been at or above career average when facing all three shot difficulties. Against low-danger shots, he has a .981 SV%. By comparison, his career SV% against these shots was .981 and he had a .983 SV% in 2014-15. Against medium-danger shots, he has a .931 SV% while he had a .929 SV% in 2014-15 and a .921 career SV% prior to this season. Finally, he is outperforming previous highs by the widest margin against high-danger shots. This season, Fleury has an .817 SV% against those chances. During the 2014-15 season, he had an .802 SV% and his career SV% was .784.
If Fleury can return from his current injury and has success the rest of the regular season, he is certain to have a top-five finish in Vezina Trophy voting for the first time. Given the quality of the defense in front of him and the lack of a true shutdown defenseman, Fleury has still been Vegas’s best player and is the perfect first franchise icon for an expansion team.
A Change in Aging Curve or Just Outliers?
With Luongo, Rinne, and Fleury in the midst their best seasons, the question is whether or not their late-career performances are a sign of change in goaltender aging curve or just three individual outliers? In 2015, In Goal Magazine published an article about how goaltenders age.
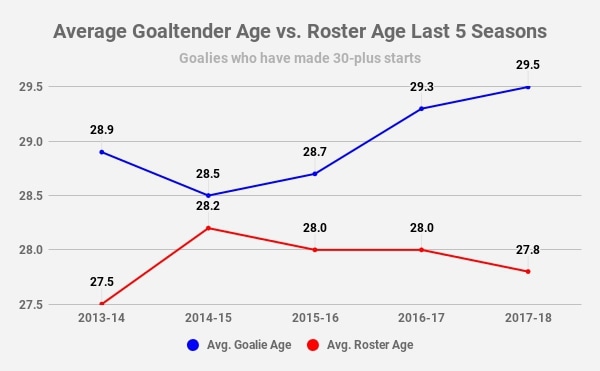
The article included how Luongo was the only goaltender over the age of 34 to appear in at least 30 games during the 2014-15 season. Since that season, the number of goaltenders 34 and above and appeared in 30 or more games has increased. In 2015-16, there were two such goalies and last season there were three. This season there have been five who have played in at least 25 games. I altered the minimum number of games played as the regular season hasn’t ended yet.
The article also discussed that between 2000 and 2015 there were an average of nine goaltenders in the league 35 and older. This season, there are seven such goalies. Last season, there were five goaltenders 35 or older and in 2015-16 there were three. Seven goaltenders 35 or above falls in line with the aging trend of goaltenders in recent seasons. For goaltenders with 30-plus starts this season, the average age is 29.5 and doesn’t include Luongo.
For the four preceding seasons dating back to the 2013-14 season, the average ages of such goalies were 29.3, 28.7, 28.5, and 28.9. The 2013-14 season, the outlier in the trend, is higher than others as a result of the 41-year-old Brodeur, the 39-year-old Thomas, and 38-year old Evgeni Nabokov.
By comparison, the average age of NHL rosters has been getting younger. This season, the average age is 27.8. The average age in the 2016-17 and 2015-16 seasons was 28.0, in 2014-15 it was 28.2, and in 2013-14 it was 27.5. This is unsurprising as prospects to break into the NHL sooner than ever before.
It used to be that only the first and second overall picks were generally guaranteed to be on the NHL roster the year of their draft. That has changed so that if a player is a top-10 pick, there is a chance he will see action in his first season. The push for youth has gotten so aggressive that Alex Nylander, selected eighth overall in the 2016 Entry Draft is debated as a bust this early in his career.
One reason for this approach is the extensive development that draft-eligible players have prior to the Entry Draft. If a player is from North America, he has opportunities to play in numerous international tournaments each year on top of their junior seasons. In those tournaments, North Americans face competition from Europeans who have already played in professional leagues against men.
This forces the North Americans to grow accustomed to playing against stiffer competition, creating a better all-around product. So, for a top prospect like Rasmus Dahlin, there is expectation for him to be in the NHL immediately when even a couple of years ago he would have been likely to either return to his native Sweden or play in the AHL to further develop.
Working simultaneously with the early arrival of prospects is the increased understanding of nutrition and conditioning that wasn’t available even 10 years ago. Players and teams have a better understanding of how rest and recovery works than ever before. Players are also more careful about what they put into their bodies. The result is players being able to remain productive into their late 30’s and even 40’s.
For goaltenders it is a bit different. Although they don’t play in the same number of games as skaters, they do play more minutes. While a number one defenseman may average 25 or 26 minutes per game, a goaltender plays all 60 minutes, minus any empty net situations and not including overtime. In those 60 minutes, the goaltender must remain alert for each one. An elite goaltender may make 60 starts in a season, rapidly increasing his workload. That kind of focus is mentally taxing and it is no wonder why Braden Holtby has struggled this season given his workload. The mental struggles don’t even include the wear and tear on a netminder’s body.
The type of flexibility required to be a goaltender in the NHL puts strain on joints, ligaments, and muscles. In 2011, James Mirtle of The Globe and Mail wrote an article highlighting the connection between injuries and the butterfly style, the most prominent style employed by goaltenders. In the piece, he interviewed former NHL goaltender Kevin Weekes about the strain put on a goaltender’s body.
“Being a butterfly goaltender is incredibly taxing and complex…I definitely think there’s a correlation between the injuries and the butterfly style.” Kevin Weekes in an interview with James Mirtle.
The article goes on to discuss how Weekes feels that the likelihood for injury has only increased as pad sizes have decreased. His reasoning is that smaller pads provide less cushioning which impacts how a goalie’s legs rotate in the hip joint. With these types of injuries unlikely to be alleviated, it seems that goaltenders performing at a high level into their late 30’s and early 40’s will continue to be an outlier.
For every Fleury, Luongo, and Rinne out there, there are more examples of goaltenders falling off a cliff late in their careers. Henrik Lundqvist is 35 years old and has struggled the past two seasons with an identical .918 even strength SV% each season. Prior to these seasons, he was consistently in the high-.920’s and mid-.930’s for SV%. His GAA, not the most reliable stat, has increased this season for the third consecutive season and his QS% has dropped over the same period.
Carey Price is another example, although much younger, at 30. When Price is healthy, he remains the league’s best goalie but he is rarely healthy. This season, he has a .909 even strength SV% which has dropped for the third straight season. At the same time, his GAA average has increased by a substantial margin each of the past three seasons, rising to 3.10 this season.
Price is still at the age where he can rebound from his poor season but health will always be a question mark. Two seasons ago, he made just 12 starts and this season he has been held to 45 games. As his workload continues to pile up and he ages, he is unlikely to return to peak Price.
As a result, relying on Luongo, Fleury, and Rinne to turn in maximum performances as they age would be foolish. Luongo and Fleury both have extensive histories on the Injured Reserve list and Rinne has been inconsistent in his career. Next season, all three could be sub-.910 goalies and fall off a cliff like Brodeur did in his final two seasons and it wouldn’t be a surprise. It wouldn’t be a surprise because they are goaltenders and the position and those who play it are fickle.
*All stats came from Hockey-Reference and Corsica
Free Newsletter
Get NHL Goaltending coverage delivered to your inbox
In-depth analysis, breaking news, and insider takes - free.
Subscribe Free →