- Capturing Each Core Four Player’s Production Over the Past Three Seasons
- What Does the Core Four’s General Production Look Like?
- What Does the Core Four’s Salary-Cap-Hit-Per-Point Look Like?
- What Does the Core Four’s Work Load Look Like?
- What the Charts Show in Conclusion
- One Possible Maple Leafs Surprise?
We recently wrote an article that predicted the Toronto Maple Leafs’ core four player’s production for the 2022-23 season using the progression and regression of each player’s production over the past four seasons.
Our goal today is to extend that post by trying to put a dollar value on each of the core four players over the past three seasons.
Capturing Each Core Four Player’s Production Over the Past Three Seasons
For the first part of the post, we are going to compare each player’s production over the past three seasons with their annual salary cap hit to see (production-wise) how much value the Maple Leafs have received from each of them.
Then, because the vast majority of people outside of the professional sports world get paid based on the time they spend working, we’ll also break down a player’s cap hit and compare it to minutes played over the past three seasons. That will help show the monetary value of their production.
What Does the Core Four’s General Production Look Like?
The one thing players don’t have control over is injuries. In an effort to account for games lost to injuries, we’ll come up with an 82-game pace for scoring for each of the four players. We’ll do that by figuring each player’s points-per-game pace over the past three seasons and extend that to an 82-game pace, which is the length of a regular NHL full season.
| Player | Games Played | Points Scored | Points Per Game | 82 Game Pace |
| Auston Matthews | 195 | 252 | 1.29 | 106 |
| John Tavares | 198 | 186 | 0.94 | 77 |
| Mitch Marner | 186 | 231 | 1.24 | 102 |
| William Nylander | 200 | 181 | 0.91 | 75 |
What Does the Core Four’s Salary-Cap-Hit-Per-Point Look Like?
Now that we’ve shown each player’s point production over the last three seasons broken down to a single season’s pace, we’ll compare that pace to their salary-cap hit to come up with a cost per point.
| Rank | Player | 82 Game Scoring Pace | Annual Cap Hit | Cap Hit per Point |
| #1 | Nylander | 75 Points | $6,962,366 | $92,832 |
| #2 | Marner | 102 Points | $10,903,000 | $106,892 |
| #3 | Matthews | 106 Points | $11,640,250 | $109,814 |
| #4 | Tavares | 77 Points | $11,000,000 | $142,857 |
This table shows that, as far as production goes, Nylander gives the Maple Leafs the most bang for the buck. Over the past three seasons, he’s cost the Maple Leafs $92,832 per point scored.

It might be surprising to some Maple Leafs’ fans that Marner ranks slightly ahead of Mattews in cap-hit-per-points scored at $106,892 to Matthews’ $109,814 per point.
It probably comes as no surprise that Tavares gives the Maple Leafs the least per-point-scored value at $142,857 per point.
What Does the Core Four’s Work Load Look Like?
The next chart looks at the value for each player per minute of ice time played.
First, we’ve figured out each player’s average ice time per game for the past three seasons. Then we extend that to an 82-game season.
| Player | Games Played | Total Minutes Played | Minutes Per Game | Ice Time \ 82 Games |
| Matthews | 195 | 4,093 | 21.0 | 1,721 |
| Tavares | 198 | 3,679 | 18.6 | 1,525 |
| Marner | 186 | 4,009 | 21.6 | 1,771 |
| Nylander | 200 | 3,565 | 17.8 | 1,460 |
Now that we have an average of minutes played for an 82-game season, we can compare that to each player’s annual salary-cap hit.
| Rank | Player | 82 Game Ice Time | Annual Cap Hit | Cap Hit per Minute Played |
| #1 | Nylander | 1,460 | $6,962,366 | $4,769 |
| #2 | Marner | 1,771 | $10,903,000 | $6,156 |
| #3 | Matthews | 1,721 | $11,640,250 | $6,764 |
| #4 | Tavares | 1,525 | $11,000,000 | $7,213 |
While the cap-hit-per-minute for these four players is much closer than the cap-hit-per-point production, the result for this chart is identical to the first one. Nylander ranks first, Marner second, Matthews third, and Tavares fourth.
What the Charts Show in Conclusion
We could have easily called this post “Fun With Numbers.” Although the work of deconstructing the value for each of the Maple Leafs’ Core Four statistically was interesting, logically the results shouldn’t be surprising. Certainly, the results of the analysis in no way influence the choices general manager Kyle Dubas and his management team make.
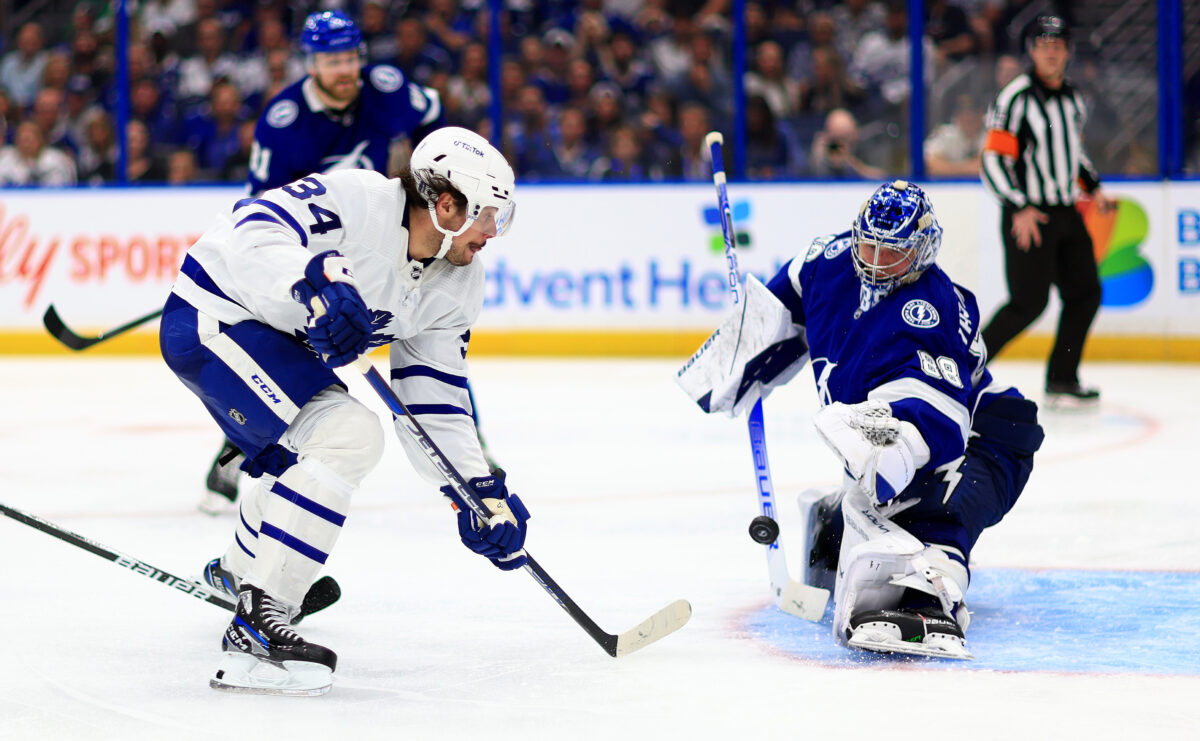
(Photo by Mike Ehrmann/Getty Images)
That said, if the analysis tells us little new information, there are some obvious conclusions. The most obvious point is that Nylander gives the team excellent value for his just less than $7 million cap hit.
The second obvious point is that using either his production or his workload, Tavares gives the Maple Leafs the least value for his salary-cap hit. But, this study does not take into consideration any intangibles Tavares brings to the team, such as mentorship and leadership.
In addition, Tavares came on a different kind of contract. When he was signed by the Maple Leafs, it was based upon what he had done in the past with the Islanders more than what he was likely to do over the long haul with the Maple Leafs.
One Possible Maple Leafs Surprise?
What might be a surprise to some Maple Leafs’ fans is that Marner, by these numbers at least, gives the team comparable value to Matthews. That’s probably a bit of a surprise.

We’re quite sure most Maple Leafs’ fans believe Matthews is THE star of the team – and by a longshot. However, Marner offers more value to the team than many people think.
The bottom line is that, in a salary-to-salary comparison, if Matthews is not overpaid then neither is Marner.
[Note: I want to thank long-time Maple Leafs’ fan Stan Smith for collaborating with me on this post. Stan’s Facebook profile can be found here.]
Free Newsletter
Get Commentary coverage delivered to your inbox
In-depth analysis, breaking news, and insider takes - free.
Subscribe Free →