- Turris in 2018-19
- Lack of Production
- Issues with Penalties and Turnovers
- A Below Replacement-Level Player
- A Sizable Regression
- What’s Behind Turris’ Regression?
- He’s Not Generating Enough Offense
- Shoot the Puck!
- Are Teammates a Contributing Factor?
- What is Expected of Him?
- Career Averages
- Comparables Based on Cap Hit
- What Can Be Done Moving Forward?
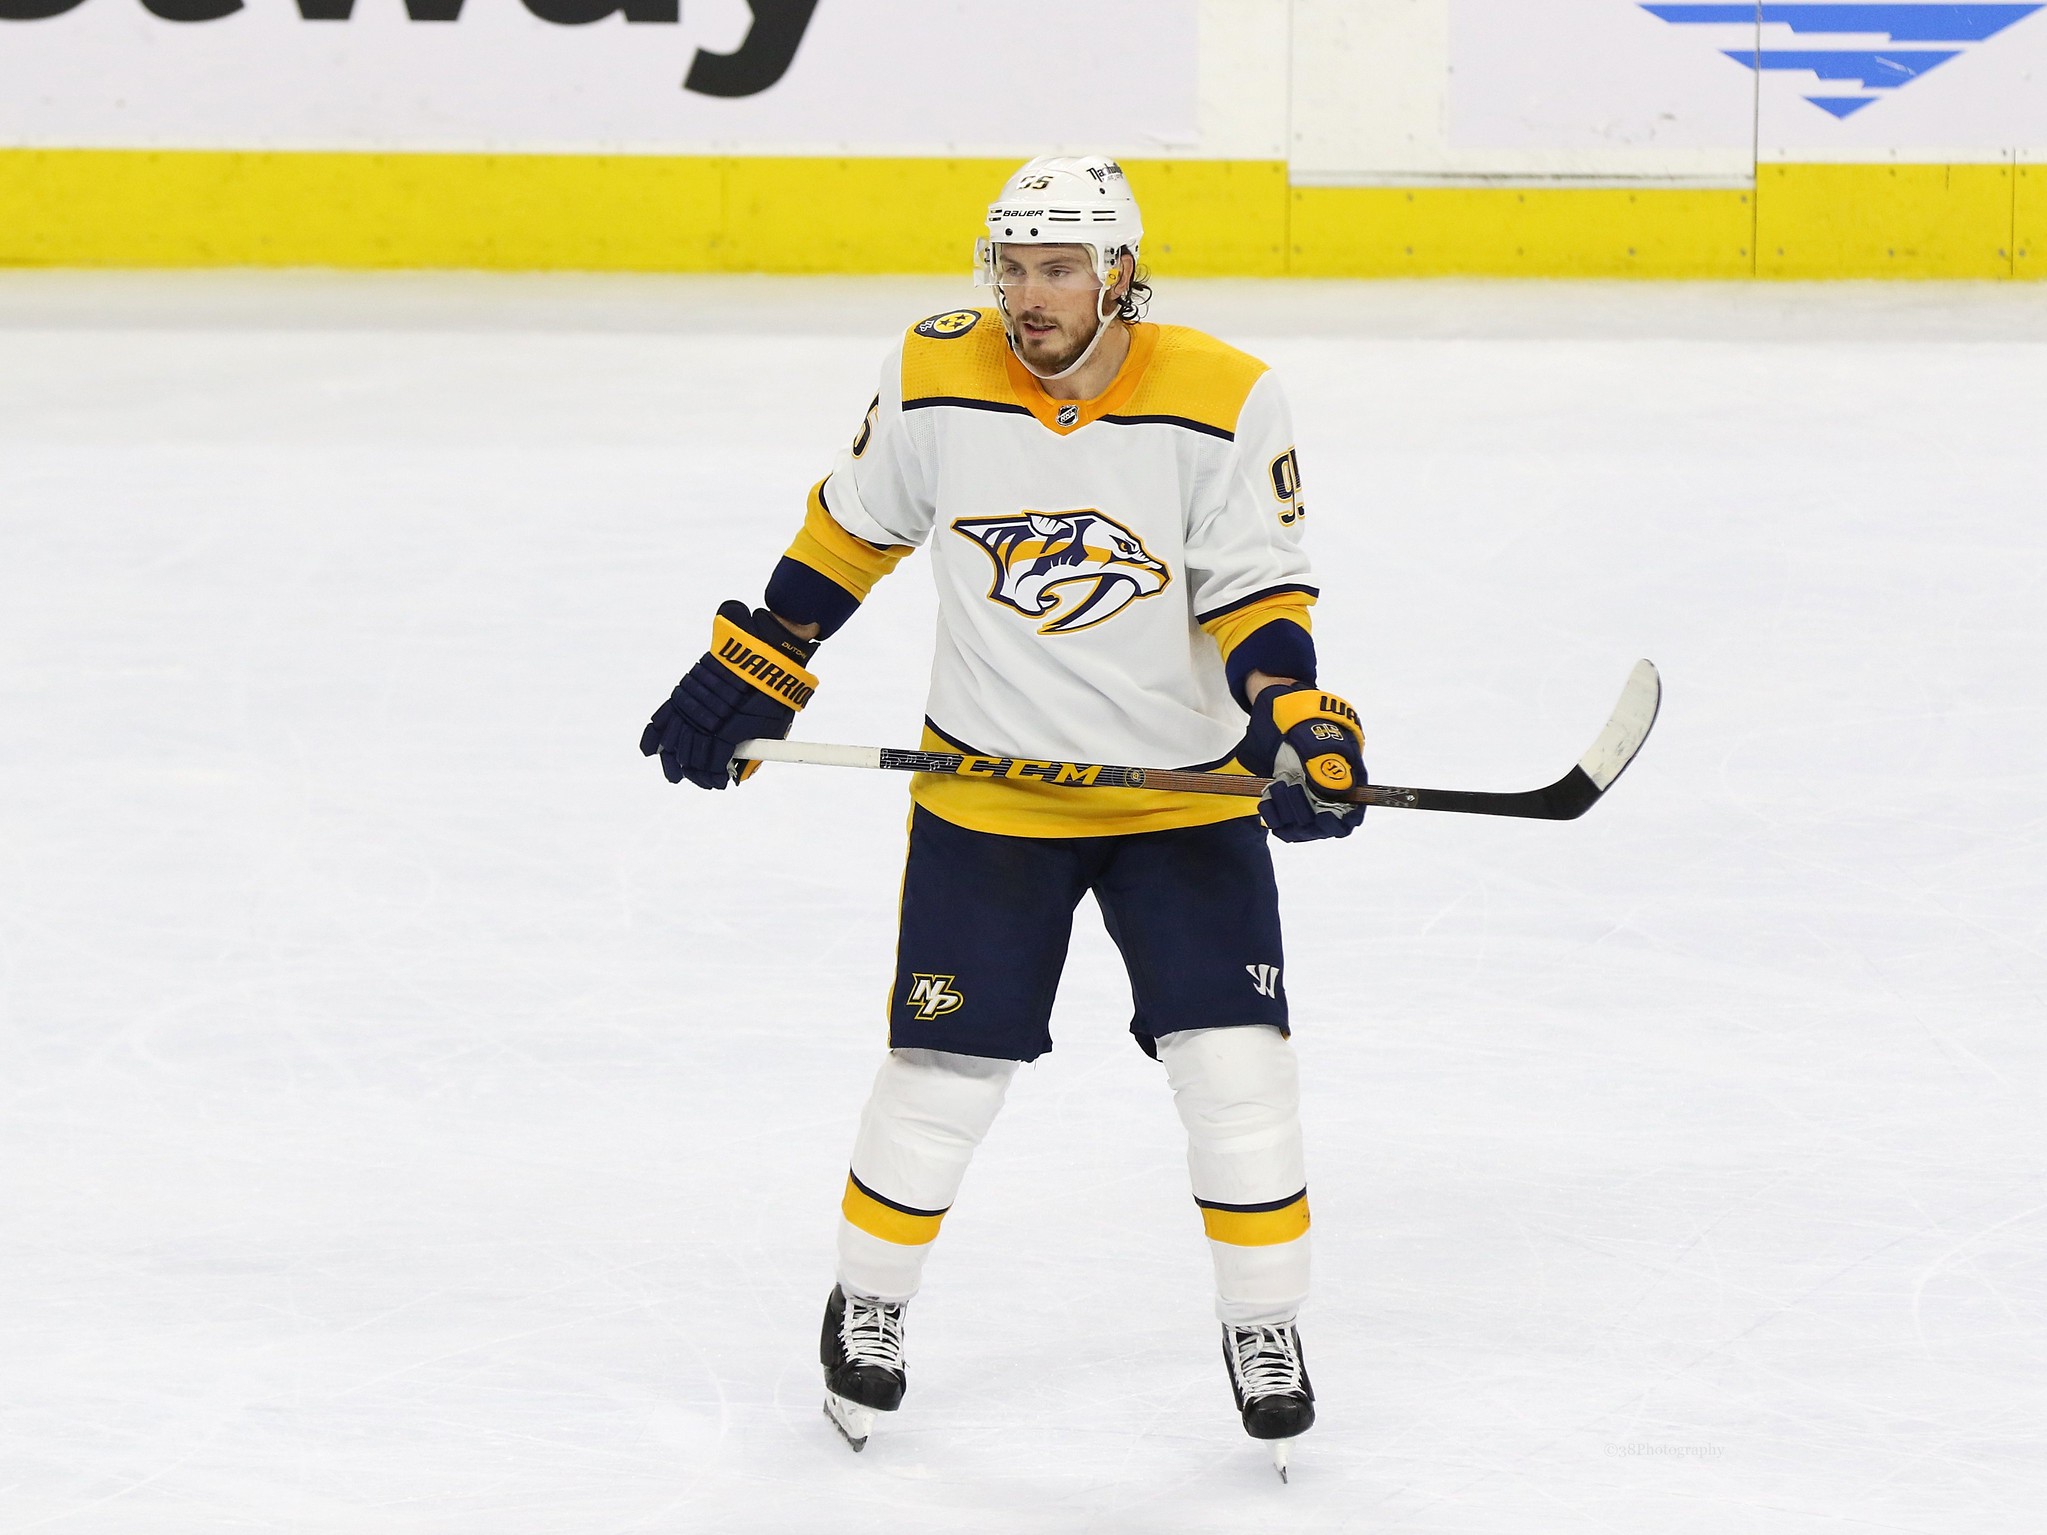
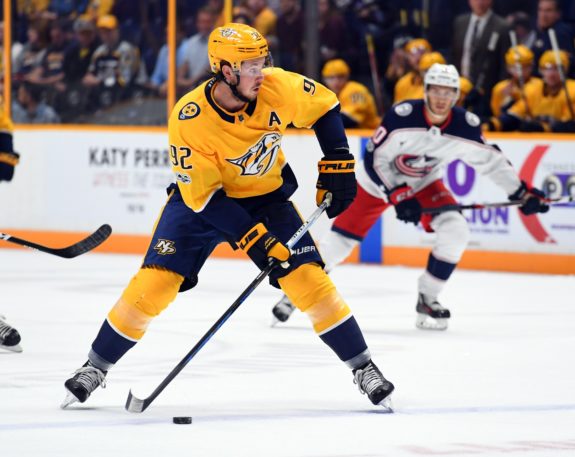
Since the Nashville Predators acquired Kyle Turris in a Nov. 2017 trade, the move has been scrutinized in the year-plus since because he has struggled to stay healthy and hasn’t lived up to expectations when on the ice. With only 20 goals and 64 points in 111 regular-season games and three points in 13 playoff games as a Predator, he has been a letdown.
Now in his age-29 season and year one of a six-year, $36-million deal, he and the Predators need to figure out what’s going on to make him a productive player again because he’s overpaid based on his current output. And that doesn’t even include the reality that the team needs him to produce as a top-six forward this season to have any hope of going far in the playoffs. I want to know what’s behind his struggles and what can be done to turn his play around, but it starts by looking at the details of his regression.
Turris in 2018-19
You can’t talk about Turris’ 2018-19 season without mentioning his injury issues. He’s only appeared in 46 of the team’s 71 games. He missed eight games between Nov. 23 and Dec. 13 with an undisclosed injury. He spent a second stint on injured reserve with a lower-body injury between late December and early February and missed 17 games. But even when he has played, he hasn’t been good.
Lack of Production
In his 46 games this season, he only has seven goals and 22 points while starting in the offensive zone 69.6 percent, the highest of his career. He has points in 19 games and multiple points in only three. Four of his goals and two of his assists have occurred on the power play. He’s shooting 11.1 percent while averaging 15:41 per-game, his lowest since 2010-11, and is winning 51 percent of faceoffs. He’s averaging .15 goals-per-game (G/G) and .48 points-per-game (P/G).
Issues with Penalties and Turnovers
If you’ve watched recent Predators games and thought that Turris has been in the penalty box quite a bit, you’d be correct. For a player who’s stayed out of the box for the majority of his career, any increase in penalty minutes is noticeable. He has 31 penalty minutes for the season, which isn’t a large amount, however it is already more than his total from last season and his .67 penalty minutes per-game tie a career high. He’s taken a penalty in 12 games this season with half of those games occurring since Feb. 9. But it gets worse than that.
His 2.58 penalty minutes per-60 minutes of ice time are the highest of his career. Taking penalties is bad enough, yet if a player draws an equal or greater amount of them, it is manageable. But Turris isn’t doing that this season. His .42 penalties drawn per-60 minutes are the lowest of his career, and by a sizable amount. It also means that he’s taking more than double the amount of penalties he’s drawing this season.
Furthermore, he’s also struggled with turnovers with a minus-three differential. That’s not bad until you consider that he’s had a positive differential in five of his nine seasons. His problems with turnovers have also shown up in advanced metrics. Using Corey Sznajder’s ‘5v5 Forward Zone Exit Risk Assessment‘ shows that Turris has averaged 8.03 exits with possession per-60 minutes and 3.06 failures per-60 minutes on zone exits. Both are worse than league averages for forwards and lead to him being labeled a ‘turnover’ player, joining fellow Predators Nick Bonino, Filip Forsberg and Miikka Salomäki.
A Below Replacement-Level Player
What I find scariest about Turris’ season is that he’s been a below replacement-level player. Using Evolving-Hockey’s goals above replacement (GAR) and wins above replacement (WAR) metrics, which measure a player’s contributions in goals and wins relative to those of a replacement-level player, show that he has been a negative in both categories.
For 2018-19, Turris has a minus-2.4 GAR and minus-0.4 WAR. His GAR breaks down to minus-0.7 at even strength, minus-0.2 on the power play and minus-1.5 in terms of penalty differential. Both his GAR and WAR are the worst on the team. This season marks the first time he’s been a below replacement-level player in either category dating back to the 2013-14 season, the first season the metrics were calculated. This suggests that 2018-19 could be a one-off and that he’ll revert back to his normal levels next season. However, that doesn’t explain his overall regression this season.
A Sizable Regression
To convey Turris’ regression, I’m looking at rate stats because they overcome the games he missed to injury that impact a season’s total stats. Furthermore, I’ll mostly be looking at per-60 stats because they take into account time on ice.
Starting out, his .15 G/G are the second-lowest of his career and mark a decline for the second straight season. His .48 P/G are his third-lowest and that rate has also regressed for the second straight season. At five-on-five, he is averaging .21 goals per-60 (G/60), the lowest of his career, and 1.24 points per-60, also a career low. His assists per-60 have stayed steady thanks to a career-high 1.04 primary assists per-60. He has had no secondary assists at five-on-five and is averaging 12:35 in ice time per-game, his lowest since 2010-11.
On the power play, where he is tied for second on the team in goals with four, Turris is skating 2:26 per-game, 13 seconds more than he did last season. He is averaging 3.20 P/60, his lowest since 2015-16, and it’s the result of a career-low .53 primary assists per-60, thanks in part to the team shooting 9.37 percent on the man advantage, lowest in the league.
What’s Behind Turris’ Regression?
So what’s behind Turris’ down season? Is it an individual issue, a lack of shooting or are his teammates impacting him? I’m going to look at teach of those in search of an answer.
He’s Not Generating Enough Offense
For starters, he is simply not creating enough scoring opportunities. On the surface, this is revealed with him shooting 11.1 percent, above his career average, while attempting 1.37 shots-per-game, a career low and .80 below his career mark. So Turris is converting on an average percentage of his chances, he’s just not putting enough pucks on net.
Looking at the 21 Predator skaters who’ve skated at least 250 five-on-five minutes this season, Turris ranks 18th with 4.77 shots-per-60 (S/60) and 14th with 4.77 individual scoring chances per-60 (iSCF/60) and in individual high-danger chances per-60 (iHDCF/60) with 1.66. Those ranks put him in a category with defensemen and third and fourth-line forwards, not top-six forwards like he’s supposed to be. All three areas are also the lowest of his career.
He also ranks poorly on the power play. Among the 13 Predators with at least 50 minutes on the man advantage in 2018-19, he ranks 12th with 4.37 S/60, 10th with 5.33 iSCF/60 and eighth with 2.13 iHDCF/60. His shots-per-60 are a career low and his individual scoring chances per-60 are second-lowest while his individual high-danger chances per-60 are fourth-highest.
Shoot the Puck!
Fellow THW writer Jon Zella recently wrote an article discussing how the New York Islanders need to shoot the puck more, and how he often finds himself yelling “shoot” at the television in an attempt to implore the team to do just that. When I read his article, I found it relatable because it’s the kind of advice that Turris needs to hear. Adam Vingan of The Athletic Nashville recently tweeted about this idea:
Kyle Turris shooting the puck, and shooting the puck from a high-danger area, should not go unnoticed. https://t.co/ggx7CfSq0D
— Adam Vingan (@AdamVingan) March 10, 2019
Turris shooting the puck more and from a more dangerous area isn’t something that should be a surprise with three 20-goal seasons to his name, yet it is. If his rate stats (shots, scoring chances, high-danger scoring chances) weren’t enough to convey that he isn’t shooting puck enough, there’s more. Sznajder’s data shows that Turris’ 6.11 S/60 (as of March 3) were well below the league’s average of 10.3 for forwards.
Then when you look at Shawn Tierney’s heat map for Turris, it’s understandable why his high-danger scoring chances are below average. Yes, there’s a high concentration of shots originating from the low slot, but most players concentrate their shots from that area. The alarming part is that besides the low slot, most of his shots originate from beyond the faceoff dots and are scattered throughout the offensive zone.

Are Teammates a Contributing Factor?
Turris’ two most common linemates, Kevin Fiala and Craig Smith, were on the ice as a trio for 126 five-on-five minutes this season before Fiala was traded to the Minnesota Wild. In those minutes, the Predators controlled 50 percent of shots, 23.1 percent of goals, 51.7 percent of scoring chances and 45.7 percent of high-danger scoring chances.
In the 227 minutes that Fiala and Smith played together without Turris, the team’s metrics increased in control of shots and goals and decreased in scoring chances and high-danger chances. So based off with or without you (WOWY) stats, Turris increased two of their metrics while negatively impacted the other two. This means that his linemates are not the reason for his regression in 2018-19.
| Shots For % | Goals For% | Scoring Chances For% | High-Danger Chances For% | |
| Turris with Fiala and Smith | 50.0 | 23.1 | 51.7 | 45.7 |
| Fiala and Smith without Turris | 51.0 | 64.7 | 49.0 | 44.2 |
Furthermore, using Hockey Viz’s threat level maps conveys that Turris has been a negative impact on the Predators. At five-on-five, the Predators have been a plus-three percent threat to score with him deployed and a plus-four percent threat without him. Meanwhile, the team’s opponents are a plus-four percent with him on the ice and a minus-one percent threat when he’s not deployed. Finally, the Predators’ power play is a minus-28 percent threat when he plays and a minus-14 percent threat when he doesn’t. That’s still not a great threat level, but it is twice the threat of when he is on the ice.
So after looking at WOWY stats and threat level differences, it’s pretty obvious that his linemates aren’t to blame for his poor season. Yes, he positively impacts two linemates’ metrics, but that’s not uncommon for any player. What are detrimental to his case are the differences in threat levels. He reduces the team’s five-on-five threat by one percent and by 14 percent on the man advantage. Defensively, he allows the opposition to be a five-percent stronger threat at five-on-five. Therefore, his regression is solely on him. But just how badly is his regression?
What is Expected of Him?
To answer that question I’m going to ask and subsequently answer two more questions: how is he performing relative to career averages and what’s expected of second-line centers? And what should he be producing based on his cap hit?

Career Averages
For his career, Turris has averaged 19.5 goals and 48.1 points per 82 games, or a full regular season. Now, he’s only played two full 82-game seasons, and his other full season was the lockout-shortened 2012-13 season, so his true seasonal averages are slightly different. Regardless, his seven goals and 22 points in 46 games this season are still below average.
On a per-game basis, he has averaged .24 G/G and .59 P/G in his 11 seasons. In 2018-19, he’s averaging .15 G/G and .48 P/G, so there’s a clear regression. The Predators acquired him to be their second-line center behind Ryan Johansen. It’s obvious that’s the player they need him to be and it’s the role his skillset dictates he serves. He may have been the Ottawa Senators’ top center, but that was out of necessity rather than preference. Unfortunately, he hasn’t fulfilled what’s been expected of him in the second-line center role since joining the Predators.
Looking through the league’s second-line centers, and not including players like Evgeni Malkin, Brayden Point, John Tavares/Auston Matthews or Evgeny Kuznetsov/Nicklas Backstrom, who would all be top centers on most other teams, reveals a production trend. The majority of them have averaged between .60 and .75 P/G for their careers. So, by comparison, Turris’ .48 P/G this season are well below the league’s average for a player in his role. But what’s even more interesting is that his .59 P/G career average is still below average and is more in line with a high-end third-line center’s production.
Now that’s not to say Turris isn’t a second-line center. He played on some relatively untalented Senators teams and hasn’t had the most consistent wingers during his tenure in Nashville. It does say suggest, though, that he’s been underwhelming relative to his intended role and he needs to step up and perform to the level that’s expected of him, especially considering the six-year extension the Predators signed him to after the trade.
Comparables Based on Cap Hit
Turris’ $6 million cap hit ties him for third-highest on the team with Forsberg and behind only P.K. Subban and Johansen. At the time, I felt the extension was an overpay considering his previous cap hit was only $3.5 million and Tennessee is a state with no income tax. It should be mentioned that he didn’t receive any trade protection, which likely increased his average annual value.
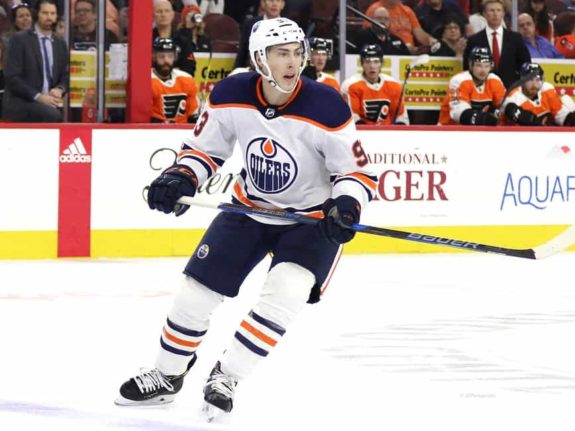
There are 21 players in the league who have a cap hit of $6 million this season. Nineteen of those players are skaters. Some notables with the same cap hit as Turris are Ryan Nugent-Hopkins, Jordan Staal, Logan Couture, Joe Pavelski and Taylor Hall. Of the 19 skaters, Turris ranks 17th in goals-per-60 and 14th in points-per-60.
However, looking at Nugent-Hopkins and Staal, both second-line centers, shows that Turris’ production isn’t out of line for a player in his role with his cap hit. For their careers, Nugent-Hopkins has averaged .27 G/G and .70 P/G while Staal has averaged .24 G/G and .57 P/G. Both players’ rates are similar to Turris’ .24 G/G and .59 P/G, making his contract and production decent for what he’s paid to do. Yet that still doesn’t excuse his regression this season.
What Can Be Done Moving Forward?
So what can happen with Turris, both now and in the future? It’s clear the Predators need him to produce for them to make a deep playoff run as their center depth takes a hit without his output. That can still happen. Maybe it involves benching him to clear hit head. Maybe it means playing him on Johansen’s wing on the top line to get him some better chances. Either way, he’s looked better in recent weeks since returning from his most-recent stint on injured reserve. Perhaps he gains momentum from now through the end of the regular season. That would be great.
Looking ahead, though, I think several things can happen. The first is that his regression is injury-related and taking an offseason to get fully healthy may help him return to his normal self. It’s not unthinkable. In 2017-18, he averaged .21 G/G and .67 P/G and that involved getting used to a new team. The season before, he averaged .35 G/G and .71 P/G. That talent level is still present and could reemerge next season.
The other option is trading him. Anytime a team pays a player $6 million per season and he doesn’t live up to expectations, it’s tough to hold onto him. Moving him is an option but it comes with the all-but-certain risk of taking a loss considering they gave up Samuel Girard, Vladislav Kamanev and a second-round pick to acquire Turris. It seems as though trading him would be for the purpose of shedding salary to make a run at a second-line center in free agency.

The best-case scenario is for Turris to find his scoring touch again and be a trustworthy second-line center for the Predators this season and moving forward. Right now the trade for him is questioned as he’s failed to live up to expectations, something only he can be held accountable for. Luckily, however, there’s still time to turn his regression around and be a contributing factor in the postseason.
*All stats from Hockey-Reference, Natural Stat Trick and PuckPedia
Free Newsletter
Get Nashville Predators coverage delivered to your inbox
In-depth analysis, breaking news, and insider takes - free.
Subscribe Free →