Owning an NHL franchise has proven to be a profitable business venture for the majority of owners of the league’s 31 member teams. On Dec. 4 the owners had just concluded their winter Board of Governors meeting where the focus was on the approval of a 32nd NHL franchise in Seattle, the salary cap for the 2019-20 season, and the financial health of the league.
The following day, Forbes Magazine released its annual “NHL Most Valuable Teams” feature for the 2017-18 season. This report is the 20th time that Forbes Magazine has published the report, which provides hockey fans insight into the financial health of the league and its teams. The numbers Forbes provides their readers are estimates of team revenues, operating incomes, and franchise market values.

The NHL, like the other three major professional sports leagues in North America, rarely disclose their financial results. They are not required to release the numbers publicly because they are a non-profit corporation. However, full financial disclosure does exist between the NHL league office, team owners, and the NHL Players Association. These exact numbers are required to calculate the salary cap for the coming season, in addition to revenue sharing among the 31 teams.
Data Collection
The industry readily accepts the Forbes Magazine’s numbers, but team owners are reluctant to confirm the accuracy of those figures. How does Forbes get the numbers? According to staff reporter, Mike Ozanian, it is an exhaustive process. They gather their information primarily from the teams, public documents, sports bankers, credit rating agencies, network executives, and media experts.
Every team was sent a questionnaire, looking for confirmation on ownership, price paid for team, various stadium information, among other information. Sports bankers were hammered with questions on past and potential deals. Publicly available information, such as leases, credit rating documents and financial statements of arenas were gathered and scrutinized. Lots of phone calls to media rights analysts for the skinny on TV deals.
Revenues and operating income (earnings before interest, taxes, depreciation, and amortization) are net of league revenue sharing and arena debt service. Income statements include revenue team owners get from non-NHL events at their arena, but would not involve extraordinary items like the $500 million expansion fee from the Knights that was divided among the other 30 teams in the league in 2017.
Forbes uses revenue multiples to calculate team values (equity plus net debt), sometimes referred to as enterprise value, based on the economics of each team’s current arena deal. If a team has a new arena, media rights deal, or sponsorship agreement that kicks in after the past season, they estimate its impact on the enterprise value going forward.
The “Top Five” Numbers
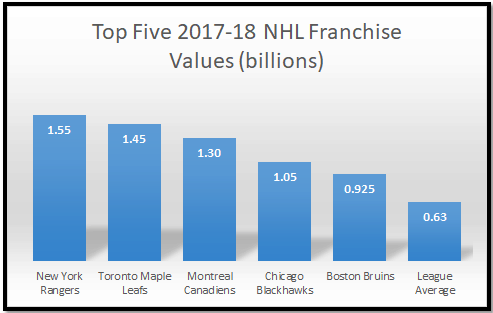
Over the last four years, the same five teams have led the NHL in franchise value. The list includes five “Original Six” organizations, with the Detroit Red Wings the only franchise not to make the “Top Five”. The New York Rangers were at the top of the franchise value list this year at $1.55 billion. The Rangers have led the NHL in franchise value over four successive years. The Toronto Maple Leafs were second at $1.45 billion, while the Montreal Canadiens finished third at $1.30 billion. The Chicago Blackhawks were next in the rankings at $1.05 billion, while the Boston Bruins were fifth at $925 million.
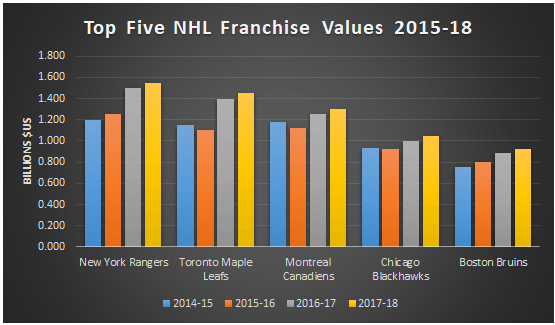
Franchise values have increased consistently for the “Top 5” over the last four seasons with the only temporary downturn experienced by the Maple Leafs, Canadiens, and Blackhawks during the 2015-16 season. The ranking order has been relatively consistent over those years with only the Maple Leafs and Canadiens changing positions for the 2015-16 and 2016-17 seasons.
Over the last four seasons, NHL owners have become wealthier, at least on paper. Average franchise values have increased from $505 million in 2014-15 to $630 million this year, a healthy increase of 25 percent. Average values rose six percent over the last year from $594 million in the 2016-17 season.
It is interesting to note that the top two franchises for value growth over the last year were the Stanley Cup champion Washington Capitals at 16 percent, while the Stanley Cup finalists Vegas Golden Knights were second at a growth rate of 15 percent. The Tampa Bay Lightning, Carolina Hurricanes and New Jersey Devils shared the third position at 14 percent. It’s fair to say winning does contribute to franchise value appreciation.

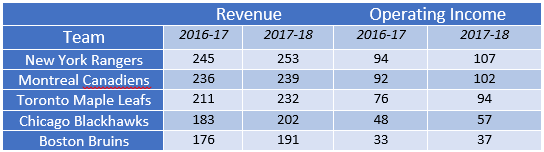
The “Top Five” teams in franchise value also dominated the league in revenues and operating income. All five teams recorded an increase in both financial metrics from 2016-17 to 2017-18. The only difference compared to the franchise value ranking order was that the Canadiens were second in both revenues and operating income, while the Leafs ranked third.
Top Five NHL Revenue & Operating Income Teams 2016-17 & 2017-18
The League Numbers
League revenues totaled $4.88 billion last year, a 10.2 percent increase over the previous season, while average franchise revenues were $157 million. Six teams lost money last year, including the Anaheim Ducks, New York Islanders, Carolina Hurricanes, Columbus Blue Jackets, Arizona Coyotes, and the Florida Panthers, who lost a league-leading $21.3 million. Even though six teams were unprofitable last year, only the Arizona Coyotes and the Florida Panthers experienced a decrease in franchise value, both dropping by only three percent.
What are the implications of these numbers? These “Top Five” teams continue to be an important component of the financial health of the NHL. The revenue numbers these “Original Six” teams post are critical to the shared revenue pool that is necessary to sustain the smaller and non-traditional hockey market teams. The financial success of these five teams helps the league to achieve its Collective Bargaining Agreement objective of competitive balance. The “economic system” appears to be working, as parity in the NHL has never been stronger.
Free Newsletter
Get The Business of Hockey coverage delivered to your inbox
In-depth analysis, breaking news, and insider takes - free.
Subscribe Free →