- 1: Number of shutouts
- 2: Shorthanded goals allowed by the Penguins (and scored by the Blue Jackets)
- 3: Games worth of suspensions
- 4: Amount of spearing offenses committed so far
- 5: Goals plus PIM recorded by Flyers forward Jason Akeson
- 6: Total shorthanded goals scored allowed
- -7: Goal differential of the LA Kings
- 8: Number of overtime periods that have been played
- 9: Number of teams that have a power-play percentage of 20% or greater
- 10: Number of games decided by exactly one goal
Playoffs have finally arrived, and it wouldn’t be any NHL postseason without some “incite-ful” events and interesting stats and facts. Here are some of the numbers from the first two games of each series (plus the third in the Montreal-Tampa Bay series) by the numbers:
1: Number of shutouts
Of the 17 games so far, there’s been just one shutout and only four games in which a team was held to one goal or less; the Bruins and Red Wings each scored one or less in the same game, as they combined for one goal in Detroit’s 1-0 win in Game 1. Detroit has accomplished this feat twice, scoring just two goals in two games.
2: Shorthanded goals allowed by the Penguins (and scored by the Blue Jackets)
In 11 opportunities, the Penguins have scored 3 PPG (27.3%) but allowed two shorties against, one of which came in Columbus’s comeback win in Game 2 (and the franchise’s first-ever playoff victory); Dan Bylsma made the mistake of leaving Malkin on the point up 3-1, and after Evgeni fumbled the puck at the line Matt Calvert took it and scored (getting the OT winner later). The Blue Jackets have had a fairly aggressive PK all season (T-6th with 9 SHG) and knew that the Penguins putting a forward on the point was a weakness, and they exploited that weakness. We’ll see if Pittsburgh adjusts for the series that’s now tied.

3: Games worth of suspensions
New Head of Player Safety Stephane Quintal is probably wondering if he made the right choice by accepting his new job, especially at the time of year when standard hockey play is most punishable. In Game 2 of the Blues-Hawks series, Brent Seabrook launched himself into St. Louis captain David Backes’s head, causing a heavy impact between his skull and the boards. Quintal made his first “Quintessential decision” by suspending Chicago’s defender for three games. Translating that into regular-season numbers, that’s basically a six-game suspension.
4: Amount of spearing offenses committed so far
Four spearing offenses where the primary point of contact was the protective cup worn on the groin region. Yes, four times have players tried to prevent their opponents from reproducing and possibly having their revenge further down the line. Only two of these spears were penalized in game and only one has received supplemental discipline, that being Milan Lucic’s groin-tap on Danny DeKeyser, which warranted only a $5,000 fine apparently (the max fine per the CBA). Other cup checks were Brandon Dubinsky on Sidney Crosby, Corey Perry on Jaime Benn, and Mike Richards on Logan Couture. Can’t we just leave each other’s man parts alone?
5: Goals plus PIM recorded by Flyers forward Jason Akeson
Jason Akeson took a terrible no-no high-sticking penalty in Game 1 that drew blood from Carl Hagelin’s lip. It was just an awful, unnecessary penalty in the third period of a tie game that lead to not only the game-winning goal, but a second power-play goal that sealed the Flyers fate. Many thought he would be benched for such an atrocious mistake, but redemption was in the water as he ended scoring the game-tying goal in Game 2 on the power play in a match that the Flyers won after being down 2-0.

6: Total shorthanded goals scored allowed
In the 38 combined games played (counting each team’s individual GP stat), six total shorthanded goals have been allowed. It might not sound too significant, but compare that number to the teams’ combined regular season SHG allowed total of 105, do some math, and you’ll see why it’s a bit high. OK I’ll do the math for you: In the playoffs, teams allow an average of .158 SHG against per game; in the regular season, these teams allowed an average of .080 SHG against per game. In other words, there have been twice as many shorties on average. (These teams combined to score 112 SHG in the regular season).
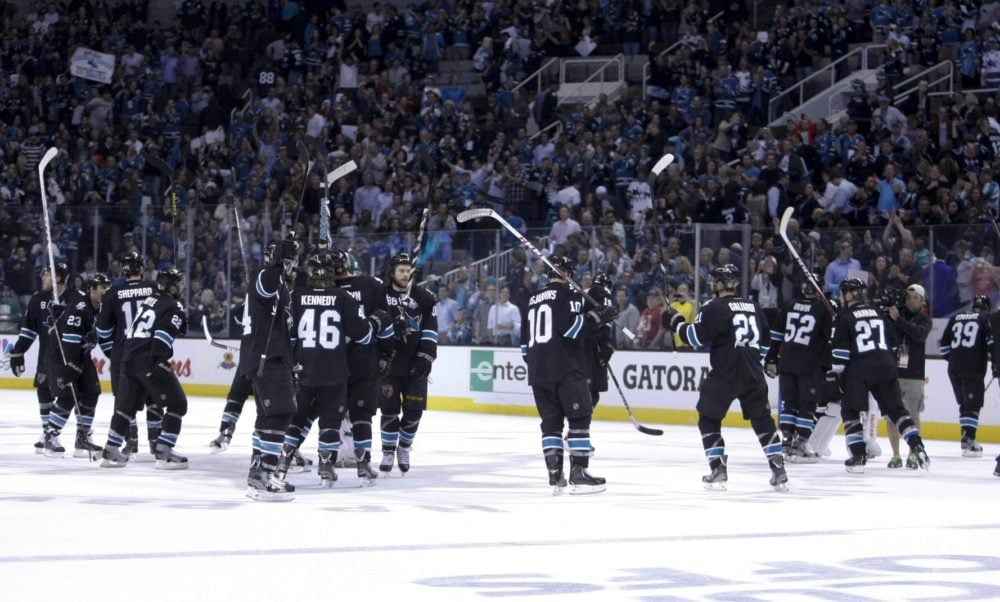
-7: Goal differential of the LA Kings
The Sharks have beaten the Kings twice and embarrassed their defense by scoring 13 goals in two games including a 7-2 blowout in Game 2. Meanwhile, the Kings have managed just five goals. Additionally, the Sharks were up by five goals in each of those two games (it was 5-0 in Game 1 before the Kings scored three unnecessary goals in the third). Let’s hope, for the sake of good hockey, that LA can turn it around at home.
8: Number of overtime periods that have been played
Five of the 17 games have gone to overtime (30%), and two of those were the same series (St. Louis and Chicago). There’s been a double-OT game and a triple-OT game. Two of the OT winners came from pretty likely sources, while the other three came from players you probably wouldn’t expect. Here are the regular-season goal totals of the overtime heroes:
- Dale Weise (MTL): 6 (61 GP)
- Alexander Steen (STL): 33 (68 GP)
- Paul Stastny: 25 (71 GP)
- Barret Jackman: 3 (79 GP)
- Matt Calvert: 9 (56 GP)
9: Number of teams that have a power-play percentage of 20% or greater
Nine of 16 teams have a power-play percentage of 20% or higher, or one more than half of all teams. Compare that to the regular season where just three teams ended at the 20% mark. Also remember that there have already been 6 SHG as well. It’s a small sample size, but is the high special-teams scoring rate a telling sign of how goals are going to be scored this postseason? Probably, when you consider that five teams finished last year at a 20% rate or higher (though three of those teams were knocked out in the first round). Here’s a fun fact though: the 16 teams have combined for nearly just as many PPG (26 in 38 games) as the Panthers scored in all of the regular season (27 in 82 games).
10: Number of games decided by exactly one goal
That’s 59% of all games. Half of these games went to overtime. That number of 10 also doesn’t include the empty netters in what ended up technically being two-goal games (Colorado over Minnesota and Philly over New York), but those games were essentially one-goal games as well. So it’s really more like 12 games (71%). What does that mean? Hopefully we’re in for a great postseason complete with close games, long series, and intense battles.
Free Newsletter
Get NHL News coverage delivered to your inbox
In-depth analysis, breaking news, and insider takes - free.
Subscribe Free →